

Crypto Fear & Greed Index Achieves Crucial Equilibrium, Shifts to Neutral at 48
BitcoinWorld
Crypto Fear & Greed Index Achieves Crucial Equilibrium, Shifts to Neutral at 48
Global cryptocurrency markets registered a significant psychological shift this week as the widely monitored Crypto Fear & Greed Index climbed 22 points to settle at 48, decisively entering the Neutral zone for the first time in months. This pivotal move away from fear-dominated territory signals a potential recalibration of investor psychology, according to data from analytics provider Alternative.me. The index, a composite measure of market emotion, now sits precisely at the midpoint of its scale, where 0 represents ‘Extreme Fear’ and 100 signifies ‘Extreme Greed.’ Consequently, this movement warrants a detailed examination of its components, drivers, and historical context to understand its full implications for the 2025 digital asset landscape.
Decoding the Crypto Fear & Greed Index’s Neutral Shift
The Crypto Fear & Greed Index functions as a daily sentiment thermometer for digital asset markets. Its calculation relies on a multifaceted methodology designed to capture both on-chain and social signals. Specifically, the index aggregates data from six core sources, each assigned a specific weight. Market volatility and trading volume each contribute 25% to the final score. Social media sentiment and market surveys each account for 15%. Finally, Bitcoin’s dominance share of the total crypto market capitalization and relevant Google search trends each provide the remaining 10%. This composite approach aims to filter out noise and present a holistic view of collective market emotion. The jump from 26 (Fear) to 48 (Neutral) within 24 hours represents one of the most substantial single-day sentiment improvements recorded this year. Analysts often view a move into the Neutral band, typically between 46 and 54, as a period of market consolidation and rational decision-making, contrasting sharply with the impulsive trading frequently observed during extreme fear or greed phases.
Analyzing the Drivers Behind the Sentiment Rebound
Several concurrent factors likely propelled the index into neutral territory. Firstly, a notable decrease in market volatility provided a primary boost. Major cryptocurrencies, including Bitcoin and Ethereum, exhibited reduced price swings over the preceding week. This stability directly positively impacts 25% of the index’s calculation. Secondly, trading volume across major exchanges saw a measured increase. This rise was not explosive but indicated renewed, steady participation rather than panic selling or frenzied buying. Thirdly, social media analysis revealed a shift in conversation tone. Discussions moved away from doom-laden predictions and toward technical analysis and project fundamentals. Furthermore, Bitcoin’s market cap dominance held relatively steady near 52%, suggesting a balanced interest between the flagship asset and alternative cryptocurrencies (altcoins). This equilibrium prevented the dominance metric from skewing the sentiment score excessively in either direction.
Historical Context and Comparative Analysis
Placing the current 48 reading in historical context offers valuable perspective. For instance, during the market troughs of late 2022, the index languished in ‘Extreme Fear’ (below 25) for prolonged periods. Conversely, during bull market peaks, it has soared into ‘Extreme Greed’ (above 75). The neutral zone often acts as a pivot point. A sustained move above 50 can precede extended bullish trends, while a fall back below 45 can signal renewed caution. The table below illustrates recent index categories and their general market implications:
| Index Range | Sentiment Label | Typical Market Behavior |
|---|---|---|
| 0-24 | Extreme Fear | Panic selling, high volatility, potential buying opportunity |
| 25-45 | Fear | Cautious selling, negative bias, consolidation |
| 46-54 | Neutral | Rational analysis, balanced buying/selling, low volatility |
| 55-74 | Greed | FOMO buying, increasing risk appetite, rising prices |
| 75-100 | Extreme Greed | Speculative frenzy, bubble risk, correction likely |
Market technicians also compare this sentiment shift to on-chain data. Metrics like exchange net flows and dormant coin movement have shown patterns consistent with a holding mentality, not a distribution phase. This on-chain behavior corroborates the neutral sentiment reading, suggesting investors are neither rushing to exit nor aggressively accumulating.
The Practical Impact on Trader and Investor Psychology
The shift to a neutral sentiment reading carries tangible psychological effects. In fear zones, investors often make decisions based on emotion, potentially selling assets at a loss. In greed zones, they may chase overvalued projects. The neutral zone, however, fosters a more analytical environment. Key behavioral impacts include:
- Reduced Emotional Trading: Decisions are more likely to stem from research and strategy.
- Focus on Fundamentals: Project development, tokenomics, and adoption metrics regain importance.
- Healthy Skepticism: Both overly bullish and bearish narratives face greater scrutiny.
- Strategic Accumulation: Long-term investors may view this as a period for disciplined dollar-cost averaging.
This environment can be particularly beneficial for new market participants. It provides a less emotionally charged atmosphere for education and portfolio construction. Seasoned analysts often advise using neutral periods to review and rebalance portfolios without the pressure of extreme market moves.
Expert Insights on Sentiment as a Contrarian Indicator
Financial historians frequently cite investor sentiment as a reliable contrarian indicator at its extremes. The famous dictum ‘Be fearful when others are greedy, and greedy when others are fearful’ aligns with this index’s utility. While a reading of 48 is not an extreme, its movement from fear toward neutrality can signal a change in market phase. Some institutional analysts interpret a climb out of sustained fear as a prerequisite for the next sustainable bullish leg. However, they caution that sentiment alone does not drive prices. Macroeconomic factors, regulatory developments, and technological advancements remain the primary fundamental drivers. The sentiment index thus serves as a gauge of market mood surrounding those fundamentals, not a standalone predictor.
Conclusion
The Crypto Fear & Greed Index’s ascent to a neutral 48 marks a critical inflection point for market psychology. This movement reflects a complex interplay of reduced volatility, steady volume, and more balanced social discourse. While not predictive of future price action, this shift indicates a departure from fear-based decision-making and a move toward a more rational, analytical market environment. For observers and participants, the index provides a valuable, quantified snapshot of collective emotion—a tool for grounding individual decisions in broader market sentiment. Monitoring whether the index stabilizes in neutrality or trends toward greed or fear in the coming weeks will offer essential clues about the next major phase for cryptocurrency markets.
FAQs
Q1: What does a ‘Neutral’ reading on the Crypto Fear & Greed Index mean?
A neutral reading (typically 46-54) suggests a balance between fear and greed in the market. It indicates a period where investor sentiment is not dominated by extreme emotion, often correlating with lower volatility and more decision-making based on fundamentals rather than hype or panic.
Q2: Who creates the Crypto Fear & Greed Index and how often is it updated?
The index is created and maintained by the data analytics platform Alternative.me. It is updated daily, providing a near real-time gauge of market sentiment based on the previous 24 hours of data from its six source components.
Q3: Is the Crypto Fear & Greed Index a reliable tool for predicting Bitcoin’s price?
No, the index is not a direct price prediction tool. It is a sentiment indicator. Historically, extreme readings (below 25 or above 75) have sometimes preceded market reversals, but it should be used in conjunction with fundamental and technical analysis, not in isolation.
Q4: Why does the index give equal weight (25% each) to volatility and volume?
Volatility measures the magnitude of price changes, with high volatility often associated with fear or uncertainty. Volume measures market activity and participation. Together, they provide a strong foundation (50% of the index) for understanding current market dynamics and trader behavior.
Q5: Can the index be manipulated by social media campaigns?
While social media sentiment is a component (15%), the index’s multi-factor design makes it difficult to manipulate meaningfully. A coordinated campaign might briefly affect the social score, but it would need to coincidentally influence volatility, volume, dominance, and search trends to significantly alter the final number, which is highly improbable.
This post Crypto Fear & Greed Index Achieves Crucial Equilibrium, Shifts to Neutral at 48 first appeared on BitcoinWorld.


You May Also Like
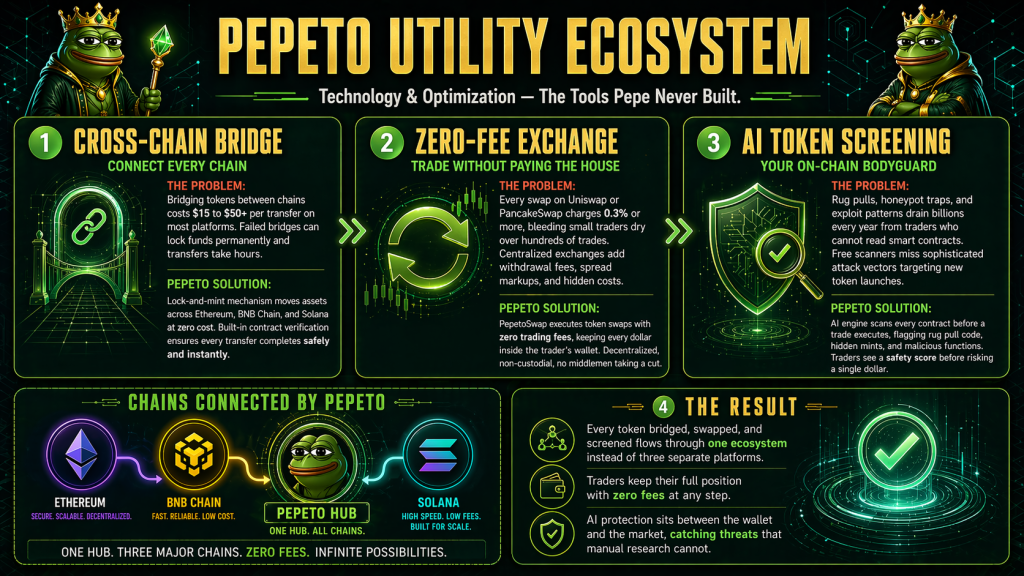
Which Are the Top 3 Cryptos to Buy Now as Solana Lands Mastercard and Pepeto Presale Nears Sold-Out Close
Ondas (ONDS) Stock Soars After Revenue Explodes Over 1,000% in Q1 2026


