

Solana crypto (SOL/USDT): bulls have the ball, but they are playing below resistance

In a broadly risk-on but not euphoric crypto market, Solana crypto (SOL/USDT) is sitting in a constructive technical zone with short-term bulls in charge.
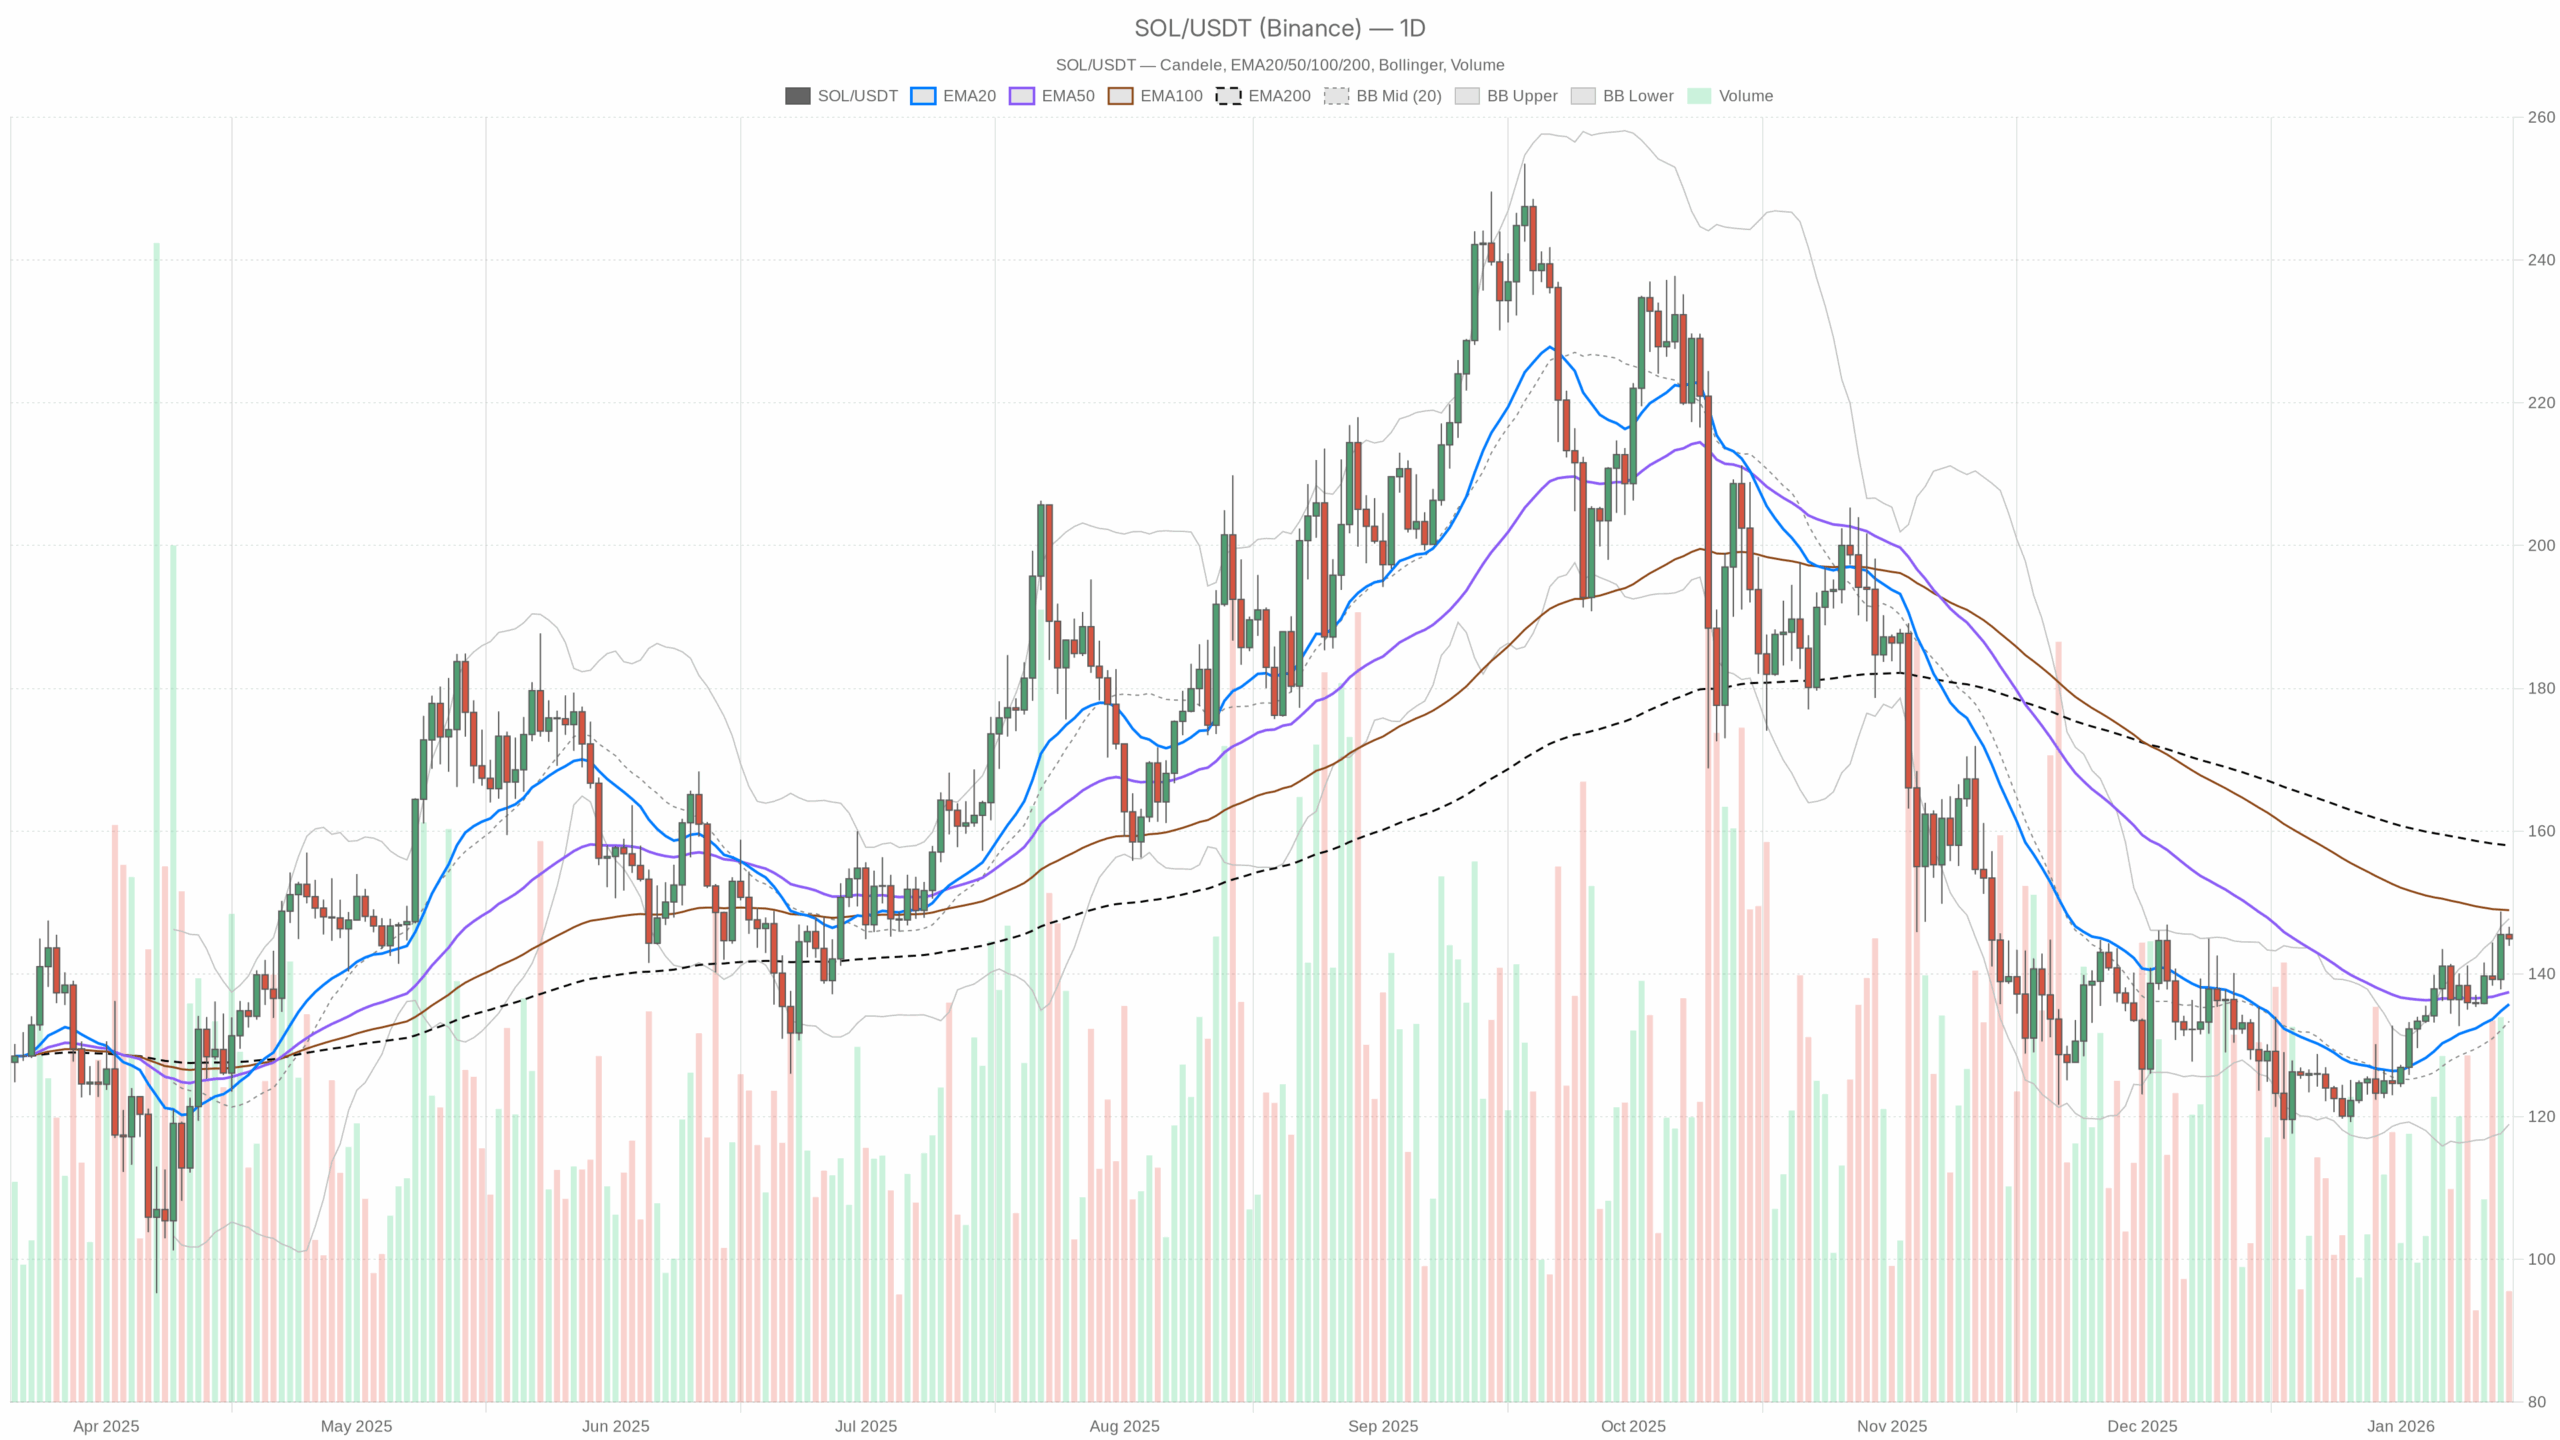 SOL/USDT — daily chart with candlesticks, EMA20/EMA50 and volume.
Daily Chart (D1): Macro Bias – Mildly Bullish, Under Structural Resistance
Trend structure: EMAs
– Close: $144.90
– EMA 20: $135.74
– EMA 50: $137.43
– EMA 200: $157.99
Price is comfortably above the 20-day and 50-day EMAs, but still below the 200-day EMA. That is a classic short-term uptrend inside a longer-term down or repair phase. The 20-day is also above the 50-day, reinforcing near-term bullish control. However, with the 200-day overhead around $158, the market is signaling that the bigger cycle trend has not flipped fully back to a confirmed bull yet. Right now the path of least resistance is higher in the short term, but there is a ceiling not far above.
Momentum: RSI
– RSI 14 (D1): 65.42
RSI is sitting in the upper neutral band, close to overbought territory but not stretched. That is strong, constructive momentum without the blow-off signs you see above 70–75. It says buyers are in charge, but the move is not so extended that a sharp correction is inevitable purely on technicals. There is room for another push higher before RSI really starts screaming “cool down”.
Momentum breadth: MACD
– MACD line: 3.35
– Signal line: 1.82
– Histogram: +1.53
MACD is firmly positive with the line above the signal and a healthy positive histogram. That is classic evidence of an ongoing bullish swing, not just a dead-cat bounce. Momentum on the daily timeframe is building, not fading, which aligns well with price holding above the 20- and 50-day EMAs. For now, the daily momentum engine is still running in favor of the bulls.
Volatility & range: Bollinger Bands + ATR
– Bollinger mid-line: $133.34
– Upper band: $147.74
– Lower band: $118.94
– ATR 14 (D1): $5.65
Price near $144.90 is leaning toward the upper Bollinger Band at $147.74, showing it is trading near the top of its recent volatility envelope. The move is not a full band breakout yet, but it is clearly a strong push in the upper half of the range. Daily ATR at $5.65 implies that 3–4% swings in a day are entirely normal here. This is active, but not wild, volatility for SOL. In practice, that means you should expect tests of nearby support and resistance to come with noise and intraday spikes rather than smooth, gentle moves.
Key reference levels: Daily pivots
– Pivot (PP): $145.14
– Resistance 1 (R1): $146.36
– Support 1 (S1): $143.68
SOL is trading just under the daily pivot at $145.14, and not far below R1 at $146.36. That puts price in a tight battle zone: marginally below intraday reference resistance but above the first meaningful support at $143.68. On the daily context, this is a digestion phase right under minor resistance. It is often a staging area either for a continuation leg higher or a short-term bull trap if buyers fail to push through.
Bottom line D1: The daily picture is mildly bullish. Short-term trend and momentum are positive, but the 200-day EMA around $158 is a bigger structural line in the sand. Until price can reclaim and hold above that, every rally sits under the shadow of still just a countertrend bounce in the eyes of longer-term players.
Hourly Chart (H1): Bulls in Control, Momentum Cooling Slightly
Hourly trend: EMAs
– Close: $144.87
– EMA 20: $144.22
– EMA 50: $142.49
– EMA 200: $138.58
– Regime: bullish
On H1, price is stacked nicely above all major EMAs, with 20 > 50 > 200. That is a clean intraday uptrend structure. The gap between price and the 200-hour EMA at $138.58 confirms that the recent leg higher has been persistent, not just a single spike. Moreover, intraday dips toward the 20- or 50-hour EMAs are currently being rewarded by buyers.
Hourly momentum: RSI
– RSI 14 (H1): 56.8
Hourly RSI is moderate and healthy. It is above midline, showing a bullish bias, but far from overbought. This often corresponds to grindy, staircase-like moves up rather than parabolic spikes. Momentum is not euphoric, but it is clearly not bearish either.
Hourly momentum breadth: MACD
– MACD line: 0.95
– Signal line: 1.10
– Histogram: -0.15
On H1, MACD shows a mild negative histogram, with the line just below the signal. That is a short-term loss of momentum within a still-bullish structure. In plain terms, the trend is up, but the immediate push is catching its breath. Often this leads to sideways consolidation or a shallow pullback rather than an immediate trend reversal, unless sellers aggressively step in.
Hourly volatility & levels: Bollinger Bands, ATR, pivots
– Bollinger mid-line: $144.39
– Upper band: $146.90
– Lower band: $141.88
– ATR 14 (H1): $1.57
– Pivot (PP): $144.95
– R1: $145.11
– S1: $144.70
Price is hugging the mid-to-upper part of the hourly Bollinger range with ATR showing around $1.57 of typical hourly range. That is active but controlled intraday volatility. The H1 pivot cluster between $144.70 and $145.11 has price sitting right on it, suggesting the market is in a short-term equilibrium zone. Traders are deciding whether to push to the upper band near $146.90 or drift back toward the lower band around $141.88.
Bottom line H1: Intraday structure is bullish, but short-term momentum has cooled. That is consistent with a pause or minor mean reversion inside an uptrend, not yet a bearish reversal signal.
15-Minute Chart (M15): Micro Execution Context
Short-term structure: EMAs
– Close: $144.87
– EMA 20: $144.86
– EMA 50: $144.70
– EMA 200: $142.41
– Regime: bullish
M15 shows price glued to the 20-EMA and only slightly above the 50-EMA. The 200-EMA is well below at $142.41. This is a tight, controlled short-term trend where dips are shallow and quickly bought, but upside acceleration has paused. Microstructure is bullish, just not explosive.
Very short-term momentum: RSI & MACD
– RSI 14 (M15): 49.62
– MACD line: -0.12
– Signal line: -0.14
– Histogram: +0.02
On 15m, RSI is basically neutral around 50, and MACD is slightly negative but stabilizing. That points to a balance between buyers and sellers at the micro level. Given the bullish higher timeframes, this kind of flat momentum on 15m typically represents a consolidation phase rather than the start of a deep reversal, unless accompanied by strong selling volume, which is not evident in the data here.
15m volatility & levels: Bollinger Bands, ATR, pivots
– Bollinger mid-line: $144.91
– Upper band: $146.00
– Lower band: $143.81
– ATR 14 (M15): $0.48
– Pivot (PP): $144.96
– R1: $145.06
– S1: $144.77
Price is pinned near the mid-line of the bands and the pivot, with a modest ATR of $0.48. That tells you this is a tight, choppy zone, good for fine-tuning entries and exits but not a directional signal by itself. Day traders will be watching breaks above $145.06 or below $144.77 for the next short-term impulse.
Putting It All Together: Trend vs. Mean Reversion
Across timeframes, the picture for Solana is:
– Daily: Short-term uptrend, positive momentum, but still below the 200-day EMA, so macro repair, not confirmed full bull.
– Hourly: Uptrend intact, momentum cooling, suggesting consolidation or shallow pullback rather than immediate breakdown.
– 15m: Sideways micro chop around pivots inside a bullish higher-timeframe context.
The dominant force right now is trend, not mean reversion, but with a clear structural cap overhead. Dips toward the short-term EMAs are likely seen as opportunities by active traders, but the risk is that once price approaches the 200-day EMA near $158, longer-term sellers or profit-takers step in aggressively.
Bullish Scenario for Solana (SOL/USDT)
The bullish path is straightforward: the current consolidation under the daily pivot resolves higher, and SOL uses the H1 and M15 pullback and cooling to reload for another leg up.
What bulls want to see:
1. Hold above near-term support: On the daily, keeping price above roughly the $135–138 area, a cluster of recent action and not far from where the 50-day EMA is, maintains the short-term uptrend structure. On intraday, holding above the H1 EMA 50 around $142.5 keeps the current leg intact.
2. Break and hold above pivots and bands: A sustained move above today's R1 levels in the $146–147 area and then a daily close above the upper Bollinger Band at $147.74 would mark a strong continuation breakout.
3. Attack the 200-day EMA: The real structural test is around $158 on the D1 EMA 200. A clean break and consolidation above that level would flip the broader narrative from countertrend rally to potential new bullish cycle, at least technically.
If this scenario plays out, the market would be signaling that buyers are willing to chase Solana higher even at elevated levels, backed by solid DeFi activity and a generally supportive crypto macro backdrop.
Bullish scenario invalidation:
The bullish case starts to lose credibility if SOL breaks down and closes below the daily 50-EMA (currently around $137.43) and then fails to reclaim it quickly. A decisive daily close back inside the lower half of the Bollinger range toward the mid-band at $133.34 would confirm that momentum has rolled over from trend to mean reversion.
Bearish Scenario for Solana (SOL/USDT)
The bearish path does not have a clean trigger yet; it is more about failure at resistance and loss of key short-term levels.
What bears need:
1. Hourly trend break: A move that drives price below the H1 EMA 50 around $142.5 and then the H1 EMA 200 near $138.6, with hourly closes staying below, would be the first sign the intraday uptrend has flipped.
2. Daily momentum rollover: A roll in daily MACD, with a bearish cross and a shrinking and then negative histogram, combined with RSI dropping back toward 50 or lower, would confirm that the current push was a local top rather than a base for continuation.
3. Failure under the 200-day EMA: If price spikes toward the $155–160 zone, tags or front-runs the 200-day EMA, and then gets quickly rejected with a long upper wick on the daily, that would be a strong distribution signal. This would be especially true if followed by a break back below the 20- and 50-day EMAs.
In that environment, the market is shifting from buy the dip to sell the rip on Solana, and rallies into resistance would be increasingly sold instead of accumulated.
Bearish scenario invalidation:
The bear case gets severely weakened if SOL can reclaim and hold above the 200-day EMA at roughly $158 on a closing basis, with daily RSI staying comfortably above 60 and MACD remaining positive. In that case, shorts would be fighting a confirmed higher-timeframe uptrend.
How to Think About Positioning, Risk, and Uncertainty
Right now, the technical setup for Solana is a short-term bullish trend pressing into higher-timeframe resistance. That combination rewards a tactical long bias with strict risk management. The volatility profile, with daily ATR around $5.65, means swings of $10+ over a couple of days are well within normal behavior, so position sizing matters more than usual.
For traders:
– The easy trade was buying below the 20- and 50-day EMAs; that window is gone. Now the game is about whether this trend extends into a test of the 200-day or rolls over first.
– Higher timeframes support an upside bias, but intraday indicators show momentum cooling, not accelerating. That argues against blind chasing and in favor of waiting for clear breaks or controlled pullbacks.
Uncertainty is concentrated around how SOL behaves if and when it approaches the $155–160 band. That is where trend followers and mean-reversion traders will collide. Until then, the tape favors the bulls, but it is not a one-way bet, and the presence of strong macro crypto flows cuts both ways: supportive on the way up, but unforgiving if risk-off hits.
If you want to monitor markets with professional charting tools and real-time data, you can open an account on Investing.com using our partner link:
Open your Investing.com account
This section contains a sponsored affiliate link. We may earn a commission at no additional cost to you.
Disclaimer: This analysis is for informational and educational purposes only and reflects a technical view of current market data. It is not investment, trading, or financial advice, and it does not consider your individual objectives or financial situation. Cryptoassets are highly volatile and can result in total loss of capital. Always do your own research and manage risk accordingly.


You May Also Like

U.S. Approves Alibaba and Tencent to Buy Nvidia H200 AI Chips

Prediction markets get CFTC relief as legal battles widen


