Bitcoin Hits $96K As Binance Founder CZ Calls $200K Rally “Obvious”
Bitcoin price broke out of a two-month consolidation to reach a high of around $97,704 on Wednesday. The world’s largest cryptocurrency was up 1.7% on the day, trading at $96,442 as of 1:13 a.m. EST, with the price at its strongest level since mid-November.
The advance triggered an estimated $455.07 million in liquidations of crypto short positions, including about $187.1 million tied to BTC, according to Coinglass.
The crypto space also edged up a fraction of a percentage to a $3.26 trillion market capitalization, as the CMC Crypto Fear and Greed Index climbed to 54, maintaining a neutral appetite in the market while investors position.
CZ Predicts Bitcoin Price Could Rally To $200K
Changpeng Zhao, Binance co-founder, has asserted that Bitcoin will reach $200,000, which he states is more about timing than probability and the most obvious bet.
In an AMA, CZ noted that there are currently no indications of a peak in its value and emphasized Bitcoin’s strong growth potential.
Additionally, he mentioned that the U.S. Securities and Exchange Commission (SEC) will not prioritize digital assets in 2026 examination efforts. Therefore, the shift is expected to reduce enforcement risks and foster a more supportive environment for BTC.
This comes even as the Senate Banking Committee delayed markup of a bipartisan market structure bill (CLARITY ACT), extending uncertainty around the legislation’s timeline. The bill was aimed at defining regulatory jurisdiction for crypto between the SEC and Commodity Futures Trading Commission (CFTC).
CZ’s Bitcoin predictions are not isolated. Fundstrat’s Tom Lee shares an optimistic outlook for the leading cryptocurrency in the short term. He suggests that BTC could reach approximately $200K-250K, driven by supportive policies and increased institutional investment.
Bitcoin ETFs Draw in Over $840 Million As BTC Surges
A surge in Bitcoin’s price to above $96,000 has triggered the strongest single day of inflows for US spot exchange-traded funds (ETFs) in three months, with these products adding $840.6 million on January 14, according to Coinglass data. This is a third consecutive day of net inflows this week.
BlackRock’s IBIT led the inflows with a $648.4 million netflow. Fidelity’s FBTC followed closely with $125.4 million netflow.
The buying pressure boosted total net assets across all US spot BTC ETFs to approximately $122.9 billion, roughly 6.5% of Bitcoin’s $1.89 trillion market capitalization.
BTC Breaks Out Of An Ascending Triangle
After consolidating for two months within an ascending triangle pattern, the BTC price has recently broken out above $94,000 in the last 3 candles within the daily chart. Technically, this move is important as a breakout above this pattern often indicates a sustained bullish rally.
By crossing the resistance area around $94,000, Bitcoin price signaled that the price being capped in a sideways pattern might finally be over.
The climb above the $90,000 area has since pushed the price of Bitcoin back above its 50-day Simple Moving Average, signaling a bullish outlook in the short term.
Bitcoin’s Relative Strength Index (RSI) is also near the overbought region, currently at 67.83, which indicates that buyers are in control without the price being overbought. This is a sign that the price still has room to rally again.
Meanwhile, the Moving Average Convergence Divergence (MACD) has also turned positive, with the blue MACD line crossing above the orange signal line.
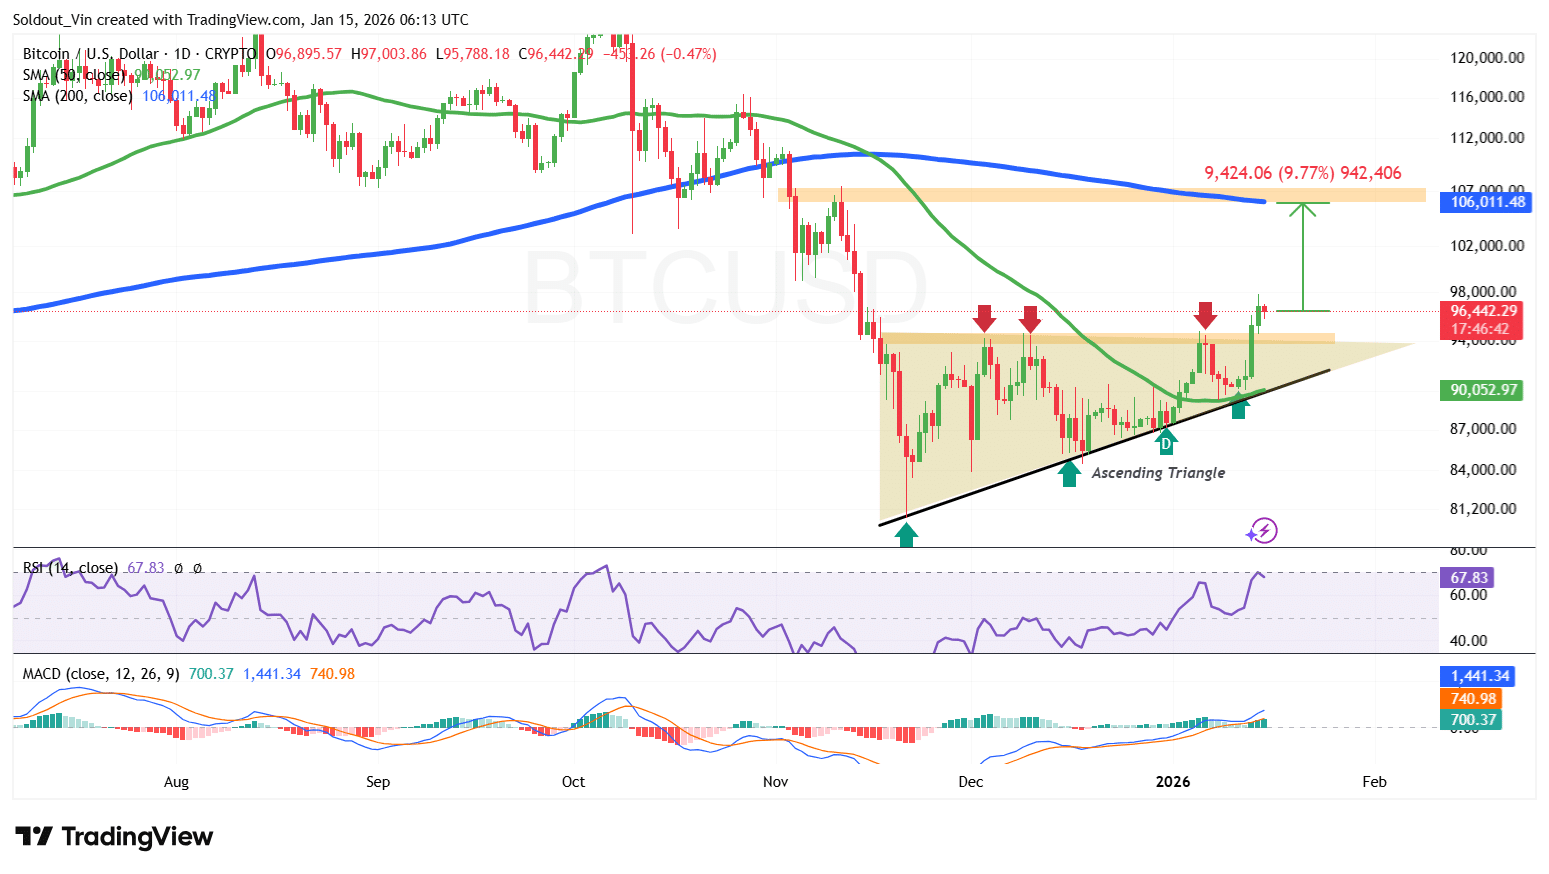 BTC/USD Chart Analysis Source: TradingView
Can the Momentum Be Sustained?
The 1-day BTC/USD chart analysis shows that the breakout above the triangle could be sustained. If this happens, buyers are looking at a 9.77% surge to the $106,011 level within the 200-day SMA.
Conversely, as a result of the 7% surge in the last week, short-term investors may still take profits, which may push the price down to the $89,000 support.
Related News:


You May Also Like

Q2 Market Insights: Bitcoin regains dominance in risk-averse environment, ETFs remain critical to market structure

Pi Network Node Update 24.1.0 Appears as Protocol 23 Deployment Expands