

Render (RNDR) Price Prediction 2026, 2027 – 2030: Long-Term Forecast and Growth Outlook

The post Render (RNDR) Price Prediction 2026, 2027 – 2030: Long-Term Forecast and Growth Outlook appeared first on Coinpedia Fintech News
Story Highlights
- The live price of the RNDR token is $ 2.26925738.
- Price predictions for 2026 range from $6.00 to $15.00.
- Long term outlook suggests gradual growth potential to approach $80 by 2030.
Render (RNDR) is a decentralized GPU rendering network designed to connect creators and developers with unused GPU computing power across the globe.
As the crypto market gradually shifts from speculative narratives toward real-world utility, Render (RNDR) continues to stand out as a critical infrastructure player within the AI and decentralized computing ecosystem.
Heading into 2026, RNDR’s price outlook is increasingly shaped by its ability to translate rising network relevance into sustainable token demand. After experiencing significant sharp expansion and consolidation cycles in previous market phases, the token now enters a period where adoption metrics, technical structure, and broader market sentiment intersect.
With AI-driven narratives expected to remain dominant over the coming years, RNDR’s long-term trajectory will depend not only on price momentum but also on how effectively the protocol scales within a competitive compute landscape making its future valuation a closely watched metric for investors.
Table of Contents
- Story Highlights
- Render Price Performance in 2025
- RNDR Price Prediction January 2026
- Render Price Prediction 2026
- RNDR Price Onchain Outlook
- RNDR Crypto Price Prediction 2026 – 2030
- Render Token Price Prediction 2026
- Render Price Forecast 2027
- RNDR Crypto Price Forecast 2028
- Render Token Price Prediction 2029
- RNDR Token Price Projection 2030
- RNDR Price Prediction 2031, 2032, 2033, 2040, 2050
- RNDR Price Prediction: Market Analysis?
- CoinPedia’s RNDR Price Prediction
- FAQs
Render Price Today
| Cryptocurrency | Render |
| Token | RENDER |
| Price | $2.2693 |
| Market Cap | $ 1,177,003,123.17 |
| 24h Volume | $ 53,369,952.1060 |
| Circulating Supply | 518,673,261.0141 |
| Total Supply | 533,433,434.2941 |
| All-Time High | $ 13.5961 on 17 March 2024 |
| All-Time Low | $ 0.0368 on 16 June 2020 |
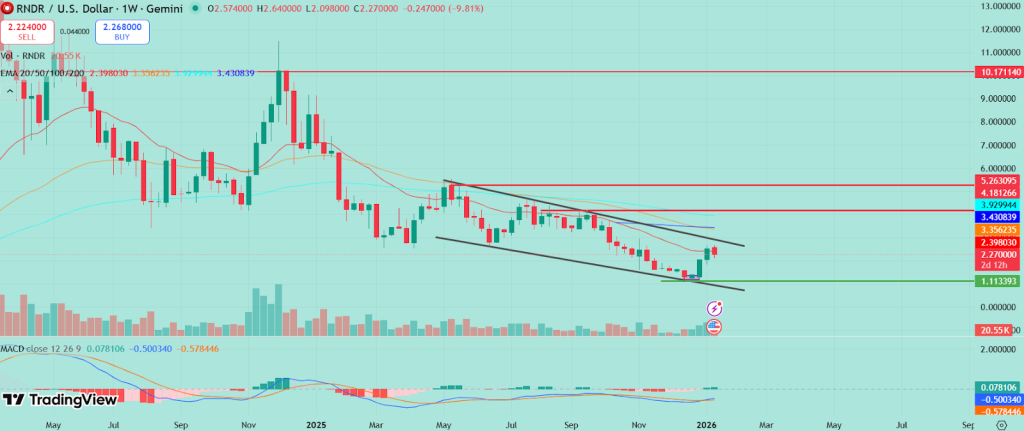
Render Price Performance in 2025
In 2025, Render experienced a consolidation phase rather than an extended bull run, reflecting both internal network maturation and broader market retest behaviour. Following notable volatility in prior years, price action consolidated into a range between $1.50 and $3.50, with repeated attempts to break above $3.50 proving transient.
This range-bound structure suggests that the token is trying to find equilibrium between seller exhaustion and renewed buying interest.

From a technical perspective, the year showed a sequence of lower highs but stabilizing support, indicating that downside pressure moderated as the year progressed.
The key long-term support developed near the $1.40-$1.60 zone, a range that absorbed multiple tests without decisive breakdowns. Overall 2025’s price action reflected structural stabilization rather than breakout momentum.
RNDR Price Prediction January 2026
January 2026 presents a technical inflection point for RNDR’s market structure. Following extended consolidation, volatility is likely to persist as traders reassess near-term catalysts. For RNDR, the immediate support zone is around the $1.70-$2.00 range, anchored by multi-month congestion lows.
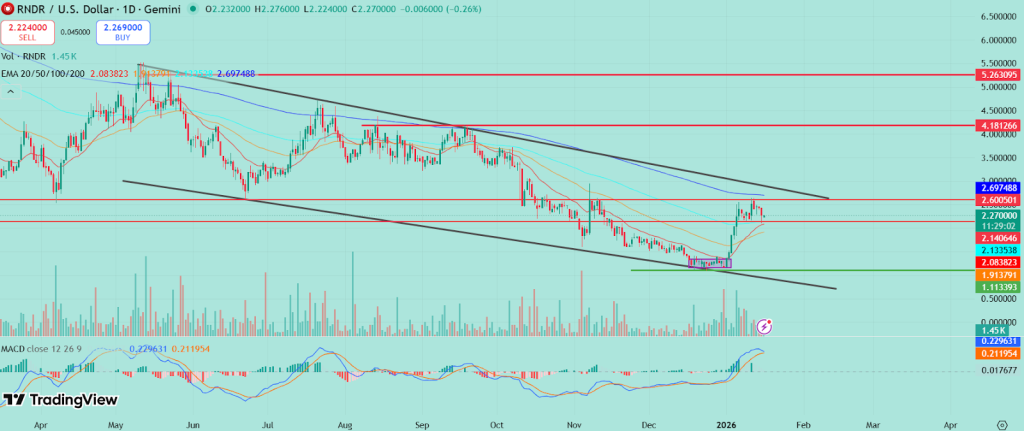
However, resistance zone is placed around swing highs around $2.70-$3.00
Overall, January 2026’s outlook will not reflect short-term sentiment but also set structural tone for RNDR’s 2026 trajectory.
Render Price Prediction 2026
From a purely technical standpoint, RNDR continues to trade within a broad accumulation structure following an extended corrective phase. The price has established a clear base above the $1.50 region, which has acted as a multi-month demand zone and repeatedly absorbed downside pressure. This level remains critical for maintaining the current market structure.
On the upside, RNDR faces layered resistance between $2.80 and $3.50. This zone represents a confluence of prior breakdown levels and volume-heavy rejection areas. Multiple failed breakout attempts in this region suggest persistent supply, indicating that a decisive close above this range is required to shift momentum in favor of buyers.
Render price action currently reflects a bounce within the channel. A confirmed breakout above $3.50, supported by increasing volume, would signal a transition into a higher-high structure, opening upside targets near $5.00 and $6.00. Conversely, rejection from resistance may lead to continued range trading or a retest of the $1.70–$1.50 support band.
Overall, RNDR remains technically neutral, with directional bias contingent on a clear resolution beyond established range boundaries.
| Year | Potential Low ($) | Potential Average ($) | Potential High ($) |
| RNDR Price Prediction 2026 | 6.00 | 10.00 | 15.00 |
RNDR Price Onchain Outlook
Render’s on-chain activity reflects a utility-driven network rather than purely speculative behavior. Token transfers are closely tied to rendering service usage, and node operator participation remains consistent. This creates a structural demand layer that can support price stability during broader market downturns.
As real-world compute demand grows, on-chain metrics such as transaction consistency and network participation could strengthen RNDR’s long-term valuation profile. However, short-term price action will continue to respond to broader market sentiment and capital flows into AI-related crypto assets.
RNDR Crypto Price Prediction 2026 – 2030
| Year | Potential Low ($) | Potential Average ($ | Potential High ($) |
| 2026 | 6.00 | 10.00 | 15.00 |
| 2027 | 9.00 | 12.00 | 20.00 |
| 2028 | 10.00 | 18.00 | 25.00 |
| 2029 | 17.00 | 25.00 | 35.00 |
| 2030 | 32.00 | 50.00 | 80.00 |
Render Token Price Prediction 2026
The RNDR price range in 2026 is expected to be between $6.00 and $15.00.
Render Price Forecast 2027
Render (RNDR) price range can be between $9.00 to $20.00 during the year 2027.
RNDR Crypto Price Forecast 2028
According to our analysts, the RNDR crypto prediction for the year 2028 could range between $12.60 and $37.83, and the average Render Token price could be around $25.22.
Render Token Price Prediction 2029
Thereafter, the RNDR price for the year 2029 could range between $17.00 and $35.00.
RNDR Token Price Projection 2030
Finally, in 2030, the price of RNDR is predicted to maintain a steady positive. It may trade between $32.00 and $80.00.
RNDR Price Prediction 2031, 2032, 2033, 2040, 2050
Based on the historic market sentiments and trend analysis of the largest cryptocurrency by market capitalization, here are the possible RNDR price targets for the longer time frames.
| Year | Potential Low ($) | Potential Average ($) | Potential High ($) |
| 2031 | 50.00 | 70.00 | 90.00 |
| 2032 | 80.00 | 100.00 | 130.00 |
| 2033 | 110.00 | 130.00 | 200.00 |
| 2040 | 220.00 | 300.00 | 450.00 |
| 2050 | 500.00 | 620.00 | 750.00 |
RNDR Price Prediction: Market Analysis?
| Year | 2026 | 2027 | 2030 |
| Changelly | $6.20 | $9.50 | $18.00 |
| CoinCodex | $10.00 | $18.00 | $22.00 |
| Binance | $14.00 | $20.00 | $30.00 |
CoinPedia’s RNDR Price Prediction
Coinpedia’s price prediction for RNDR is neutral to bullish. However, Render’s prospects are rooted in the expansion of decentralized compute markets and persistent growth in AI-driven workloads.
Long-term price growth will depend on adoption, technological robustness, and macro risk tolerance, all of which require careful monitoring.
CoinPedia expects that RNDR Price to reach $15.00 by the year-end.
On the downside, if RNDR price sees a downtrend in the upcoming months, which may collapse the coin’s price to $6.00.
| Year | Potential Low ($) | Potential Average ($) | Potential High ($) |
| 2026 | 6.00 | 10.00 | 15.00 |
Never Miss a Beat in the Crypto World!
Stay ahead with breaking news, expert analysis, and real-time updates on the latest trends in Bitcoin, altcoins, DeFi, NFTs, and more.
FAQs
RNDR is expected to trade between $6.00 and $15.00 in 2026, depending on adoption growth, AI demand, and overall market conditions.
Render price in 2030 could range between $32 and $80, depending on AI adoption, decentralized compute demand, and broader crypto growth.
Render’s 2040 price could range from $220 to $450 if decentralized GPU networks become core infrastructure for AI and metaverse use cases.
Yes, Render has a future if demand for AI, 3D rendering, and decentralized computing continues to grow and the network scales efficiently.


You May Also Like

Ethereum Price Today: ETH At $2,138

$4 Trillion Tokenized Assets by 2028 Could Ignite DeFi Boom, Standard Chartered Says


