RENDER Eyes Bullish Surge as Octane 2026 Launch Boosts GPU Rendering
Render Network offers Octane 2026 and represents a huge leap forward in terms of decentralized GPU rendering. It comes with next-gen Gaussian Splats and Meshlets and supports realistic geometry and faster rendering. Virtual Textures also make it more efficient in terms of handling large textures while maintaining quality.
It also brings support for OpenPBR, MaterialX, and additional AOVs, which brings Octane 2026 more in line with industry standards. With the Render Network, users are able to tap into virtually unlimited GPU power, solidifying the network’s position as a fundamental infrastructure service in future content creation.
RENDER holds Fibonacci support as the bullseye gets high.
However, the data from More Crypto Online pointed out that the token is currently trading at a significant technical level due to its price being stuck in a Fibonacci support area.
It appears that this area has been a resistance point for a potential fall for now, indicating that buyers are not giving up. It is important to note that being stuck at a significant technical area has not changed its short-term trend; however, a breakout has not occurred.
Source: X
Technically speaking, the structure of the waves is being watched very closely. For the full bullish potential to be realized, one more higher high is required to confirm the five-wave move higher. For the time being, the outlook is cautiously optimistic.
In the short run, the micro level of support is clearly established between $1.77 and $2.17. This will help the token decide whether to go for a consolidation phase or continue its upward movement.
Market Cap Hints at a Bullish Reversal
Looking at the chart, one can see that the token’s market cap has reversed from a downtrend and has created a base before a strong bullish surge. The prices have moved above the 20 and 50 EMAs, indicating a short-term trend change. The strong green candles indicate fresh buying interest in the market. The expanding Bollinger Bands indicate high volatility in favor of buyers.
Source: TradingView
In the short term, market cap is currently consolidating above the middle Bollinger Band. This is a sign of strong bullish positioning rather than exhaustion. On this chart, immediate support comes from the 100-day EMA, while resistance comes from near the upper Bollinger Band. Breaks above these points may lead to further upward momentum.
Also Read: Render (RENDER) Set to Soar: Could Hit $7 Soon!


You May Also Like

Robotics Automation Prototyping: Engineering Kinetic Agility into End-Effectors
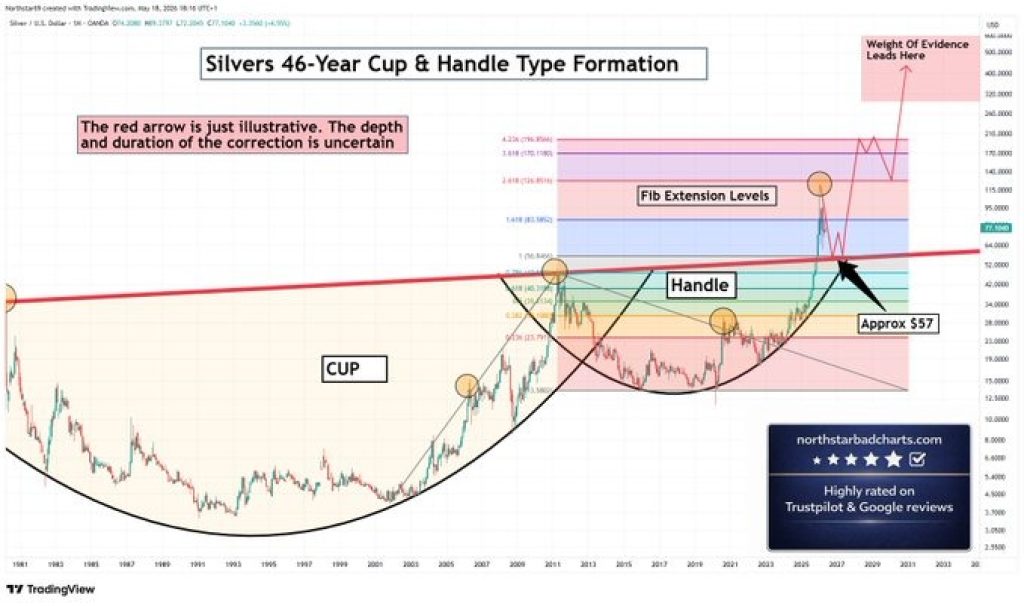
Silver Price Prediction: Cup and Handle Points to $196 – Why the Correction Was Always Part of the Plan