

Bitcoin ETFs Note $1.4 Billion Inflows This Week As Indicator Flashes Buy Signal
Bitcoin price has shown mild bearish pressure in recent sessions as global markets remain uncertain and traders adopt a cautious stance. BTC has struggled to build strong upside momentum, yet downside remains contained.
Notably, strong demand for spot Bitcoin ETFs suggests investor positioning may be shifting toward a more constructive outlook.
Bitcoin Notes A Buy Signal
Spot Bitcoin ETFs recorded inflows of $1.42 billion over the past week, marking the highest weekly total in three months. This surge reflects renewed institutional interest during a period of muted price action. The last comparable inflow spike occurred in October 2025, when ETFs attracted $2.71 billion.
Such inflows often signal growing investor confidence. Capital entering ETFs typically reflects longer-term positioning rather than short-term speculation. The current trend suggests market participants expect Bitcoin price appreciation, reinforcing bullish sentiment despite near-term volatility and mixed macroeconomic signals.
Want more token insights like this? Sign up for Editor Harsh Notariya’s Daily Crypto Newsletter here.
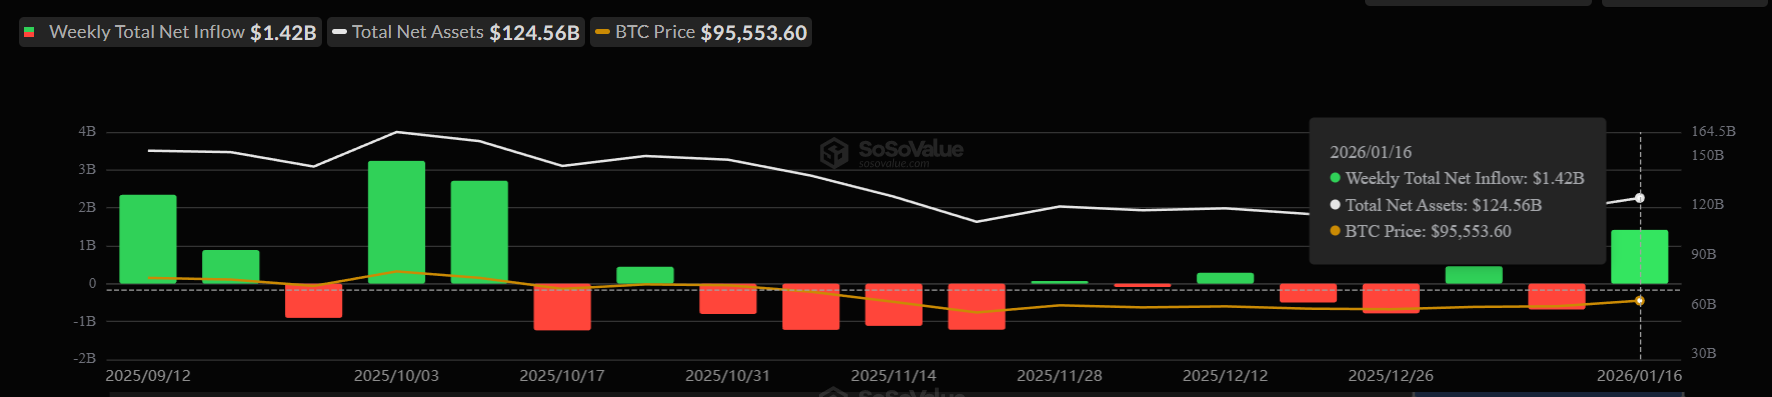 Bitcoin Spot ETFs. Source: SoSoValue
Macro indicators also support a constructive outlook. The Pi Cycle Top Indicator, a historical measure of overheated Bitcoin markets, is currently diverging. This tool compares the 111-day simple moving average with the 2×365-day moving average to identify cycle peaks.
At present, these averages are moving farther apart rather than converging. This separation indicates the market is not overheated. Historically, such conditions align with low-risk or early-to-mid bull market phases. The signal contrasts sharply with typical sell conditions, reinforcing the presence of an active buy signal.
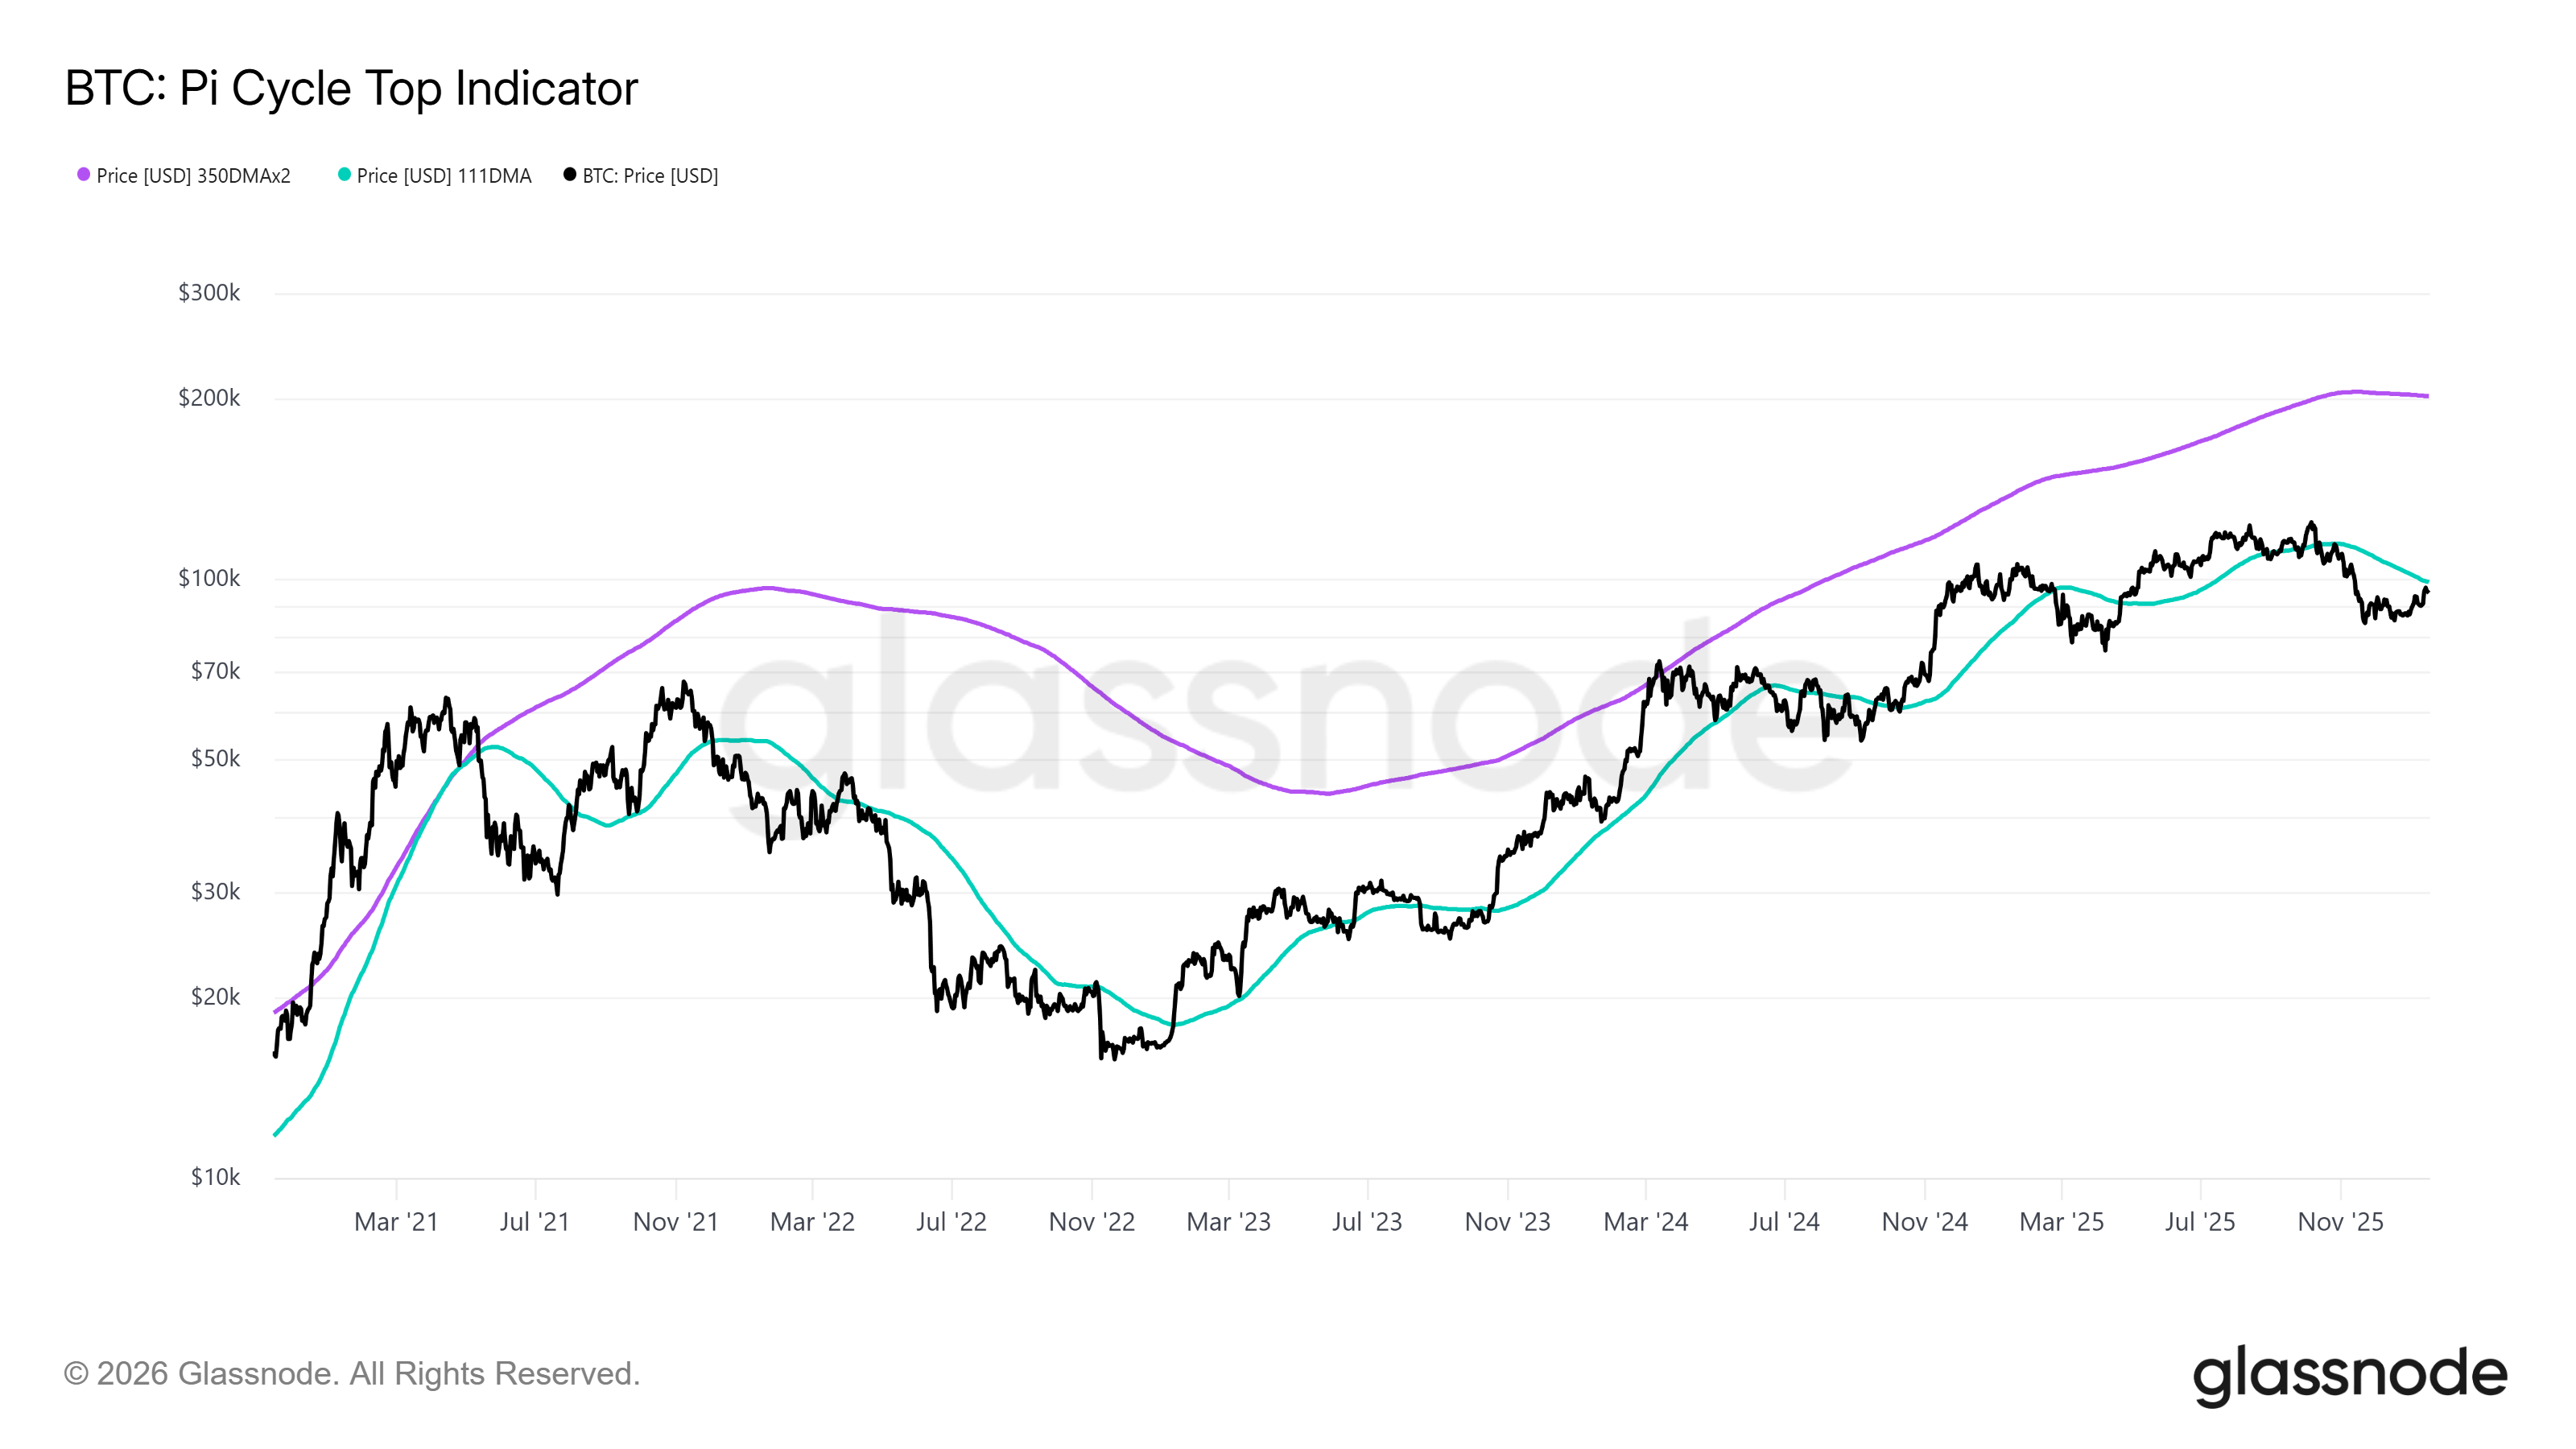 Bitcoin Pi Cycle Top Indicator. Source: Glassnode
BTC Price May Not Face Correction
Bitcoin price trades near $95,173 at the time of writing, maintaining support above the critical $95,000 level. This zone has held firm despite repeated tests, suggesting buyers remain active. Sustained ETF inflows could provide the demand needed to lift the price from this consolidation range.
If bullish conviction persists, BTC could rebound toward $98,000. Such a move would also allow Bitcoin to reclaim the 200-day exponential moving average near $95,986. Clearing that level would restore bullish momentum and strengthen the case for a push toward the $100,000 psychological threshold.
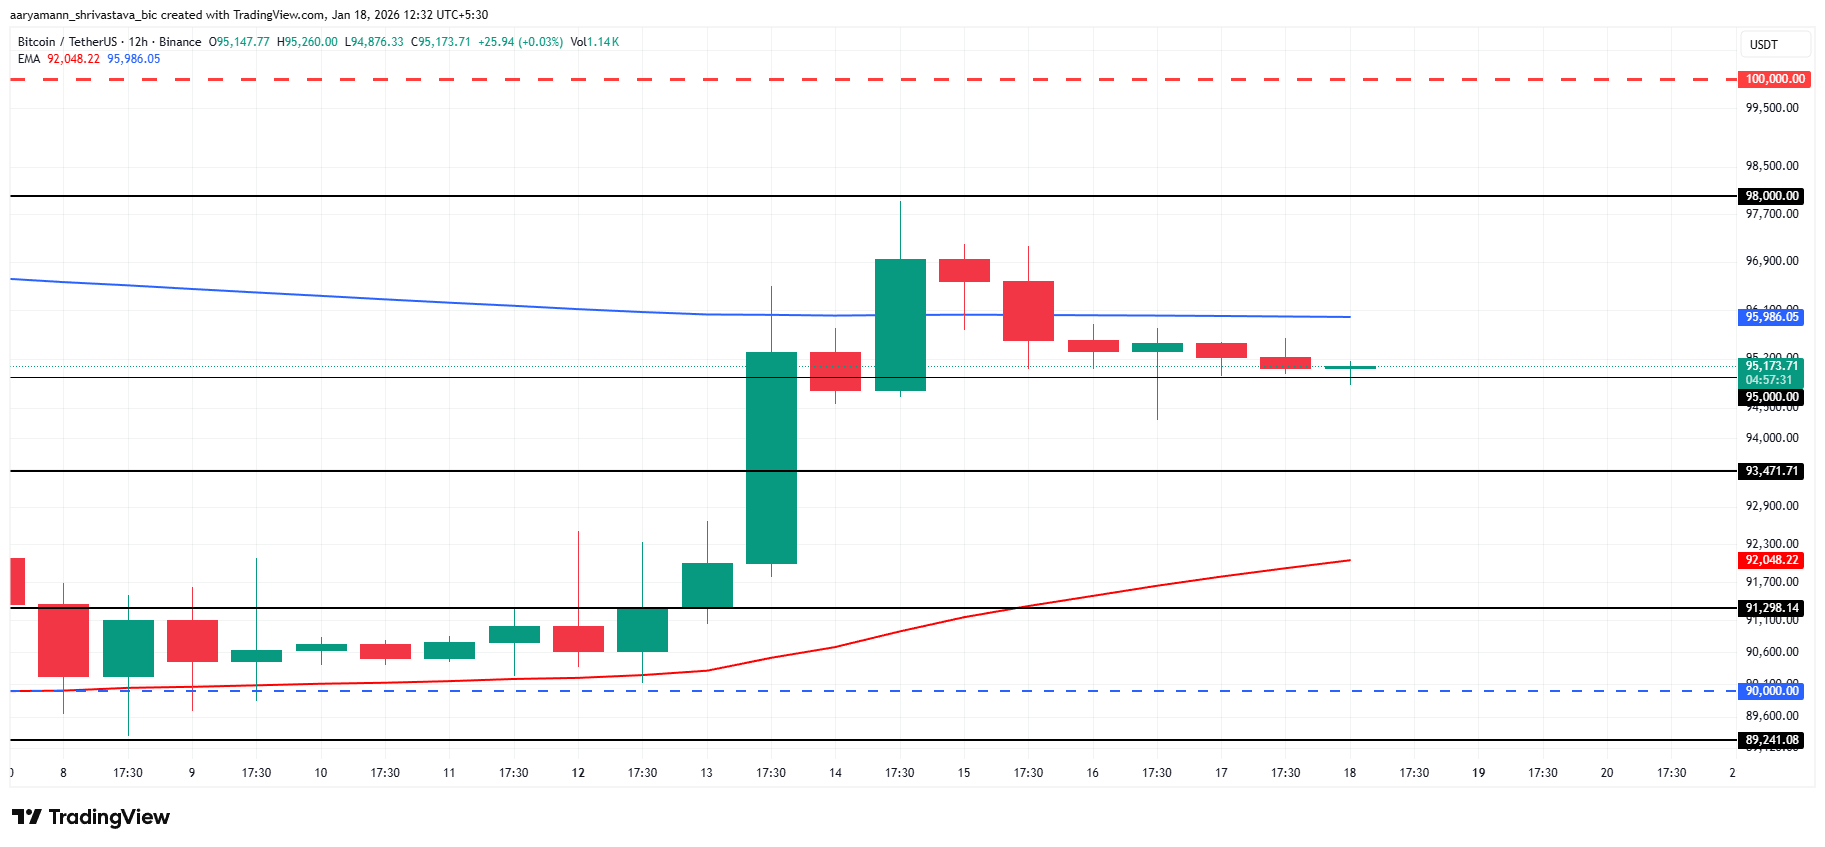 Bitcoin Price Analysis. Source: TradingView
However, risks remain. If investor sentiment shifts or spot ETFs begin recording outflows, the bullish setup would weaken. Under that scenario, Bitcoin could lose $95,000 support. A breakdown would expose BTC to a decline toward $93,471, signaling renewed downside pressure.


You May Also Like

REPORT | ~90% of 2025 Web3 Funding in Nigeria was Grant-Based

There’s a secret message embedded in Trump's Bible-reading stunt


