

Solana (SOL) Price: Network Activity Hits Four-Month Peak As RWA Value Crosses $1 Billion
TLDR
- Solana (SOL) price reached $143 after three consecutive weeks of gains, up 20% from its December low
- Network activity hit a four-month high with transaction volume reaching $457 million, the highest since August 2025
- Real-world assets (RWAs) on Solana crossed $1 billion for the first time this week
- US spot Solana ETFs recorded $46.88 million in inflows last week but saw their first outflow of $2.2 million on Friday
- Technical indicators show bearish pressure as SOL dropped 3% on Monday, falling below key moving averages
Solana price traded at $143 after completing its third straight week of gains. The cryptocurrency peaked at $148 during the week before pulling back.
 Solana (SOL) Price
The price now sits 20% higher than its December low. This marks a recovery from the downtrend that started in September 2025.
Weekly charts show Solana has closed in positive territory for three consecutive weeks. The cryptocurrency tested resistance near the $146 level multiple times during this period.
Network activity on Solana reached levels not seen since August 2025. Transaction volume hit $457 million for the week, representing the highest weekly total in four months.
 Source: Blockworks
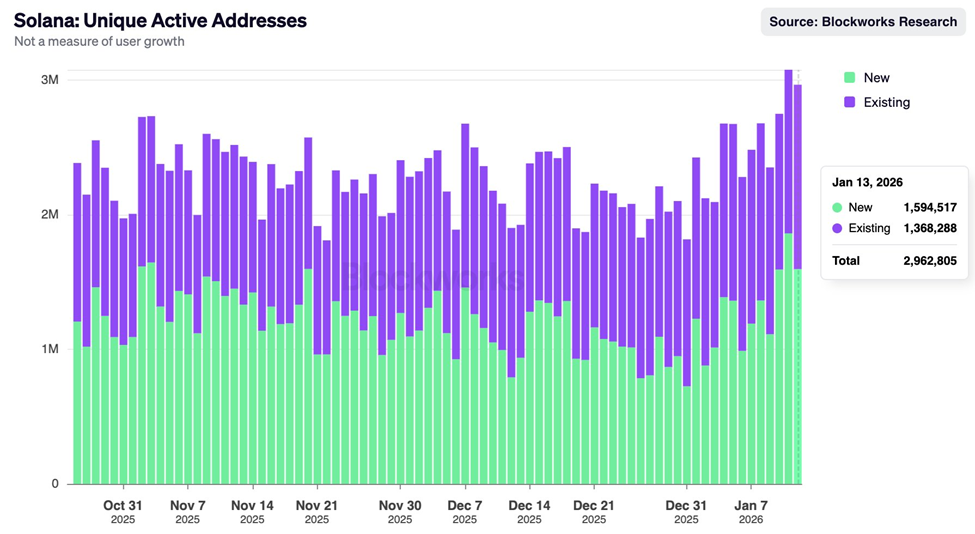
Active addresses on the network increased substantially since late December. New addresses approached 1.6 million while existing addresses reached 1.36 million on the highest day of activity this past week.
Rising RWA Ecosystem Fuels Growth
Real-world assets on the Solana blockchain surpassed $1 billion this week. This milestone represents a new focus area for the network as meme coin activity has decreased.
 Source: RWA
Data shows RWAs on Solana have been growing at an exponential rate. The network has positioned itself as a major blockchain for supporting real-world asset tokenization in 2025.
Solana’s stablecoin market cap increased from $13.1 billion on January 11 to $15 billion. Total value locked (TVL) also rose from $8.36 billion in late December to $9.16 billion.
ETF Inflows Show Mixed Signals
US spot Solana ETFs recorded $46.88 million in net inflows during the week. However, Friday marked a turning point for these investment products.
The ETFs experienced their first outflow since launch on Friday, with $2.2 million leaving the funds. This happened despite the overall positive weekly performance.
The US market was closed Monday for Martin Luther King Jr. Day. ETF trading will resume Tuesday.
On Monday, Solana dropped 3% to trade near $130. The price fell below the 20-day and 50-day exponential moving averages at $137-$138.
Long liquidations in Solana derivatives reached $59.08 million over 24 hours. Short liquidations totaled only $1.38 million during the same period.
Futures open interest declined by roughly 7% to $8.19 billion. The funding rate stood at -0.0004%, indicating a sell-side bias among traders.
Technical indicators show the Moving Average Convergence Divergence (MACD) crossed below the signal line on the daily chart. The Relative Strength Index (RSI) fell to 45, moving below the midpoint.
Resistance sits at the supply zone near $148. A break above this level could push the price toward the 200-day exponential moving average at $159.
The post Solana (SOL) Price: Network Activity Hits Four-Month Peak As RWA Value Crosses $1 Billion appeared first on CoinCentral.


You May Also Like

What a $900 Investment in New Crypto Protocols Could Become by Late 2027

Bitcoin (BTC) Hovers Above $77K Amid Iran Diplomacy and Rising Treasury Yields


