The post Bitcoin Price Regains Momentum—Can Bulls Push BTC Above Bearish Pressure? appeared first on Coinpedia Fintech News The Bitcoin price is jiggling aroundThe post Bitcoin Price Regains Momentum—Can Bulls Push BTC Above Bearish Pressure? appeared first on Coinpedia Fintech News The Bitcoin price is jiggling around

Bitcoin Price Regains Momentum—Can Bulls Push BTC Above Bearish Pressure?

2026/01/20 00:46
2 min read
For feedback or concerns regarding this content, please contact us at [email protected]
Bitcoin Trend Cools After Spike to $98K Key BTC Price Levels to Watch Over the Next 48 Hours

The post Bitcoin Price Regains Momentum—Can Bulls Push BTC Above Bearish Pressure? appeared first on Coinpedia Fintech News

The Bitcoin price is jiggling around $93,000 after marking an intraday low below $92,000, which has prevented the bulls from being dominant. Currently, the token is flashing mixed signals, with the price action becoming more and more defensive. On the other hand, the derivatives have also cooled down, suggesting traders are de-risking ahead of major macro events instead of rushing for the exit. With the CPI and GDP prints in focus, the upcoming BTC price action could be extremely important. 

What is the Chart Pointing At?

The CryptoQuant Bitcoin Bull-Bear Market Cycle Indicator is essentially a momentum “weather map” for Bitcoin’s longer cycle. When the signal prints in warmer colours (bull/overheated bull), it typically reflects stronger risk appetite and trend strength. When it fades into the blue “bear” zones, it suggests the market is cooling and that upside momentum is weakening.

bitcoin price

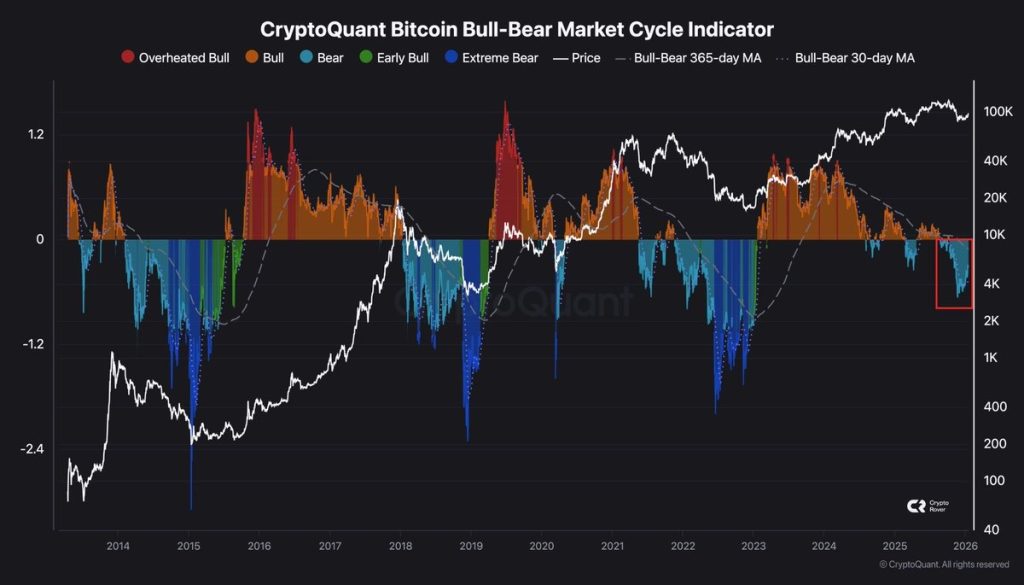
Right now, the indicator has slipped into the blue bear region, which historically tends to appear during pullbacks, consolidation phases, or early-stage downturns. However, the key point is that this tool is not a switch that flips from bull to bear overnight. It’s better read as a warning that conditions are softening, not proof that the entire cycle has ended.

The chart highlights past periods where the indicator dipped into bearish territory without immediately triggering a prolonged bear market. This looks more like a mid-cycle reset where the momentum has cooled, but there is no clear sign. Hence, the traders need to wait and watch the support closely as a breakdown may only trigger a bear market. 

What’s Next for the BTC Price—Will it Hold the Support at $90K?

Bitcoin’s next move hinges on the $90K support zone. If BTC holds that level on a closing basis and macro data doesn’t flip markets decisively risk-off, the current CryptoQuant “bear zone” read is more likely a mid-cycle cooldown, not a full trend breakdown. In that case, a rebound could first target the $95K area, followed by a push back toward the $100K psychological mark, with $106K–$110K possible if momentum fully returns. However, a clean close below $90K would shift the bias bearish and open downside targets near $88K, $85K, and potentially $80K.

Market Opportunity
Bitcoin Logo
Bitcoin Price(BTC)
$67,098.45
$67,098.45$67,098.45
+0.37%
USD
Bitcoin (BTC) Live Price Chart
Disclaimer: The articles reposted on this site are sourced from public platforms and are provided for informational purposes only. They do not necessarily reflect the views of MEXC. All rights remain with the original authors. If you believe any content infringes on third-party rights, please contact [email protected] for removal. MEXC makes no guarantees regarding the accuracy, completeness, or timeliness of the content and is not responsible for any actions taken based on the information provided. The content does not constitute financial, legal, or other professional advice, nor should it be considered a recommendation or endorsement by MEXC.

You May Also Like

Today’s Biggest Crypto Movers: Dogecoin Leads the Pack

Today’s Biggest Crypto Movers: Dogecoin Leads the Pack

Today's Biggest Crypto Movers: Dogecoin Leads the Pack 🚀 Crypto Markets Heat Up Today Major cryptocurrencies are showing strong gains. Let's dive into today's top
Share
Blockchainmagazine2026/04/03 13:00
RWA Boom Accelerates As Tokenized Assets Hit New Highs In Early 2026

RWA Boom Accelerates As Tokenized Assets Hit New Highs In Early 2026

RWA distributed value rose from about $21B to $27.5B in Q1 2026, a gain of roughly 30%. Tokenized US Treasuries reached about $10B, creating an on-chain yield base
Share
LiveBitcoinNews2026/04/03 13:00
Cryptos Signal Divergence Ahead of Fed Rate Decision

Cryptos Signal Divergence Ahead of Fed Rate Decision

The post Cryptos Signal Divergence Ahead of Fed Rate Decision appeared on BitcoinEthereumNews.com. Crypto assets send conflicting signals ahead of the Federal Reserve’s September rate decision. On-chain data reveals a clear decrease in Bitcoin and Ethereum flowing into centralized exchanges, but a sharp increase in altcoin inflows. The findings come from a Tuesday report by CryptoQuant, an on-chain data platform. The firm’s data shows a stark divergence in coin volume, which has been observed in movements onto centralized exchanges over the past few weeks. Bitcoin and Ethereum Inflows Drop to Multi-Month Lows Sponsored Sponsored Bitcoin has seen a dramatic drop in exchange inflows, with the 7-day moving average plummeting to 25,000 BTC, its lowest level in over a year. The average deposit per transaction has fallen to 0.57 BTC as of September. This suggests that smaller retail investors, rather than large-scale whales, are responsible for the recent cash-outs. Ethereum is showing a similar trend, with its daily exchange inflows decreasing to a two-month low. CryptoQuant reported that the 7-day moving average for ETH deposits on exchanges is around 783,000 ETH, the lowest in two months. Other Altcoins See Renewed Selling Pressure In contrast, other altcoin deposit activity on exchanges has surged. The number of altcoin deposit transactions on centralized exchanges was quite steady in May and June of this year, maintaining a 7-day moving average of about 20,000 to 30,000. Recently, however, that figure has jumped to 55,000 transactions. Altcoins: Exchange Inflow Transaction Count. Source: CryptoQuant CryptoQuant projects that altcoins, given their increased inflow activity, could face relatively higher selling pressure compared to BTC and ETH. Meanwhile, the balance of stablecoins on exchanges—a key indicator of potential buying pressure—has increased significantly. The report notes that the exchange USDT balance, around $273 million in April, grew to $379 million by August 31, marking a new yearly high. CryptoQuant interprets this surge as a reflection of…
Share
BitcoinEthereumNews2025/09/18 01:01

Trade GOLD, Share 1,000,000 USDT

Trade GOLD, Share 1,000,000 USDTTrade GOLD, Share 1,000,000 USDT

0 fees, up to 1,000x leverage, deep liquidity