The post BNB Price at a Crossroads: What Happens Next as Market Pressure Builds? appeared first on Coinpedia Fintech News As the broader crypto markets struggleThe post BNB Price at a Crossroads: What Happens Next as Market Pressure Builds? appeared first on Coinpedia Fintech News As the broader crypto markets struggle

BNB Price at a Crossroads: What Happens Next as Market Pressure Builds?

BNB Price Analysis: Will Binance Coin Break Past $1,000 Next?

The post BNB Price at a Crossroads: What Happens Next as Market Pressure Builds? appeared first on Coinpedia Fintech News

As the broader crypto markets struggle to find momentum, BNB Coin (BNB) is quietly holding its ground. With volatility has cooled across major assets, BNB continues to trade within a tight range, refusing to give back recent gains. Instead of reacting to short-term noise, price action suggests the market is reassessing value, not existing positions. 

The hesitation has placed the BNB coin at a clear crossroads. The question now is not whether pressure exists, it does but whether buyers have done enough to keep control as the market searches for direction.

BNB Price Searches for a Direction as Volatility Tightens

BNB price chart shows price compressing within a rising structure after a bounce from the demand zone of $830-$850. The series of higher highs and higher lows continue to form above the $880 support zone, while overhead resistance places around $930-$950 caps upside attempts.

BNB price chart

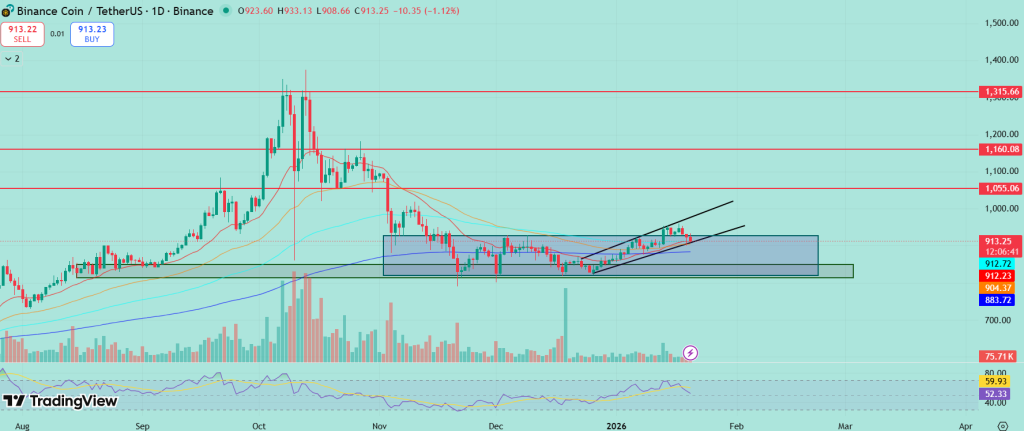
Moreover, trading volume has gradually tapered during the recent consolidation around $900. Importantly, BNB price remains above its short-term and medium-term moving averages, which favors the bullish narrative. Once the broader market direction clears, BNB may outperform the market and reach $1000 followed by $1160 in the near sessions. For now, price structure suggests balance between bulls and bears, not weakness.

What the On-Chain Data Suggests ?

BNB’s on-chain data continue to provide structural support. The network recently executed its 34th quarterly token burn, removing roughly 1.37 million BNB from circulation. This ongoing deflationary pressure tightens available supply during periods of sustained demand.

BNB On chain

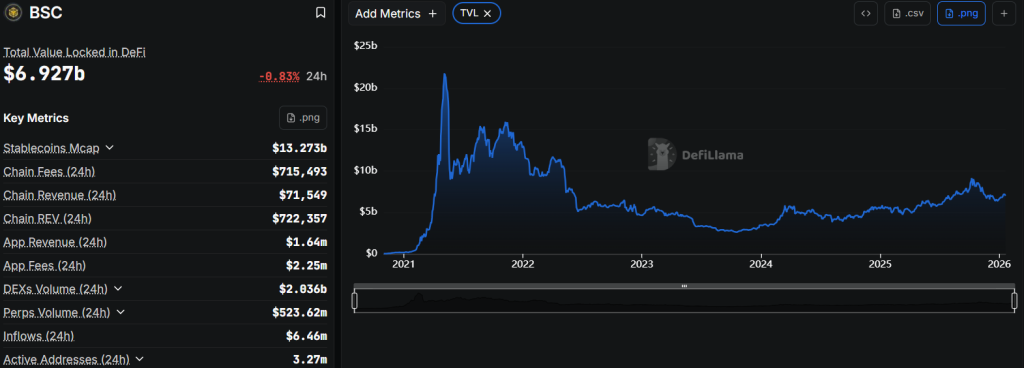
At the same time, BNB Chain activity has remained resilient. Total Value Locked (TVL) across the ecosystem has climbed above $7 billion, while transaction throughput and DeFi participation show steady engagement rather than decline. These metrics suggest that users are still deploying capital on the network, even as the price pauses. 

While these developments may not trigger immediate price spikes, they reinforce the idea that BNB’s current range is more likely structural consolidation than distribution.

What Comes Next for BNB

Currently, BNB price sits at a decision point. If buyers maintain control above the support zone of $900, further higher high swing formation could follow ahead. Conversely, a failure to hold the demand zone would signal that consolidation has turned into distribution, opening the door to a deeper retracement.

BNB’s current price behaviour reflects a market that is pausing with intent, not retreating in fear. The chart structure remains intact, downside is protected, and compression suggests a larger move is being prepared. However, direction will matter, but the setup is already telling the rally toward $1000 soon.

Market Opportunity
Binance Coin Logo
Binance Coin Price(BNB)
$879,85
$879,85$879,85
-2,82%
USD
Binance Coin (BNB) Live Price Chart
Disclaimer: The articles reposted on this site are sourced from public platforms and are provided for informational purposes only. They do not necessarily reflect the views of MEXC. All rights remain with the original authors. If you believe any content infringes on third-party rights, please contact [email protected] for removal. MEXC makes no guarantees regarding the accuracy, completeness, or timeliness of the content and is not responsible for any actions taken based on the information provided. The content does not constitute financial, legal, or other professional advice, nor should it be considered a recommendation or endorsement by MEXC.

You May Also Like

Microsoft Corp. $MSFT blue box area offers a buying opportunity

Microsoft Corp. $MSFT blue box area offers a buying opportunity

The post Microsoft Corp. $MSFT blue box area offers a buying opportunity appeared on BitcoinEthereumNews.com. In today’s article, we’ll examine the recent performance of Microsoft Corp. ($MSFT) through the lens of Elliott Wave Theory. We’ll review how the rally from the April 07, 2025 low unfolded as a 5-wave impulse followed by a 3-swing correction (ABC) and discuss our forecast for the next move. Let’s dive into the structure and expectations for this stock. Five wave impulse structure + ABC + WXY correction $MSFT 8H Elliott Wave chart 9.04.2025 In the 8-hour Elliott Wave count from Sep 04, 2025, we saw that $MSFT completed a 5-wave impulsive cycle at red III. As expected, this initial wave prompted a pullback. We anticipated this pullback to unfold in 3 swings and find buyers in the equal legs area between $497.02 and $471.06 This setup aligns with a typical Elliott Wave correction pattern (ABC), in which the market pauses briefly before resuming its primary trend. $MSFT 8H Elliott Wave chart 7.14.2025 The update, 10 days later, shows the stock finding support from the equal legs area as predicted allowing traders to get risk free. The stock is expected to bounce towards 525 – 532 before deciding if the bounce is a connector or the next leg higher. A break into new ATHs will confirm the latter and can see it trade higher towards 570 – 593 area. Until then, traders should get risk free and protect their capital in case of a WXY double correction. Conclusion In conclusion, our Elliott Wave analysis of Microsoft Corp. ($MSFT) suggested that it remains supported against April 07, 2025 lows and bounce from the blue box area. In the meantime, keep an eye out for any corrective pullbacks that may offer entry opportunities. By applying Elliott Wave Theory, traders can better anticipate the structure of upcoming moves and enhance risk management in volatile markets. Source: https://www.fxstreet.com/news/microsoft-corp-msft-blue-box-area-offers-a-buying-opportunity-202509171323
Share
BitcoinEthereumNews2025/09/18 03:50
WTI drifts higher above $59.50 on Kazakh supply disruptions

WTI drifts higher above $59.50 on Kazakh supply disruptions

The post WTI drifts higher above $59.50 on Kazakh supply disruptions appeared on BitcoinEthereumNews.com. West Texas Intermediate (WTI), the US crude oil benchmark
Share
BitcoinEthereumNews2026/01/21 11:24
MYX Finance price surges again as funding rate points to a crash

MYX Finance price surges again as funding rate points to a crash

MYX Finance price went parabolic again as the recent short-squeeze resumed. However, the formation of a double-top pattern and the funding rate point to an eventual crash in the coming days. MYX Finance (MYX) came in the spotlight earlier this…
Share
Crypto.news2025/09/18 02:57