Bitcoin is undergoing a decisive pullback after the strong recovery that followed the early-January reset. The price has been rejected from a major confluence areaBitcoin is undergoing a decisive pullback after the strong recovery that followed the early-January reset. The price has been rejected from a major confluence area

Bitcoin Price Prediction: is BTC About to Plummet Below $90K This Week?

Bitcoin is undergoing a decisive pullback after the strong recovery that followed the early-January reset. The price has been rejected from a major confluence area around $98,000, where higher-timeframe resistance and a key moving average cluster are.

It is now rotating lower while still holding above the most important higher-low zones established during December.

The current phase, therefore, appears as a test of support strength within a maturing corrective structure rather than a confirmed trend reversal.

Bitcoin Price Prediction: The Daily Chart

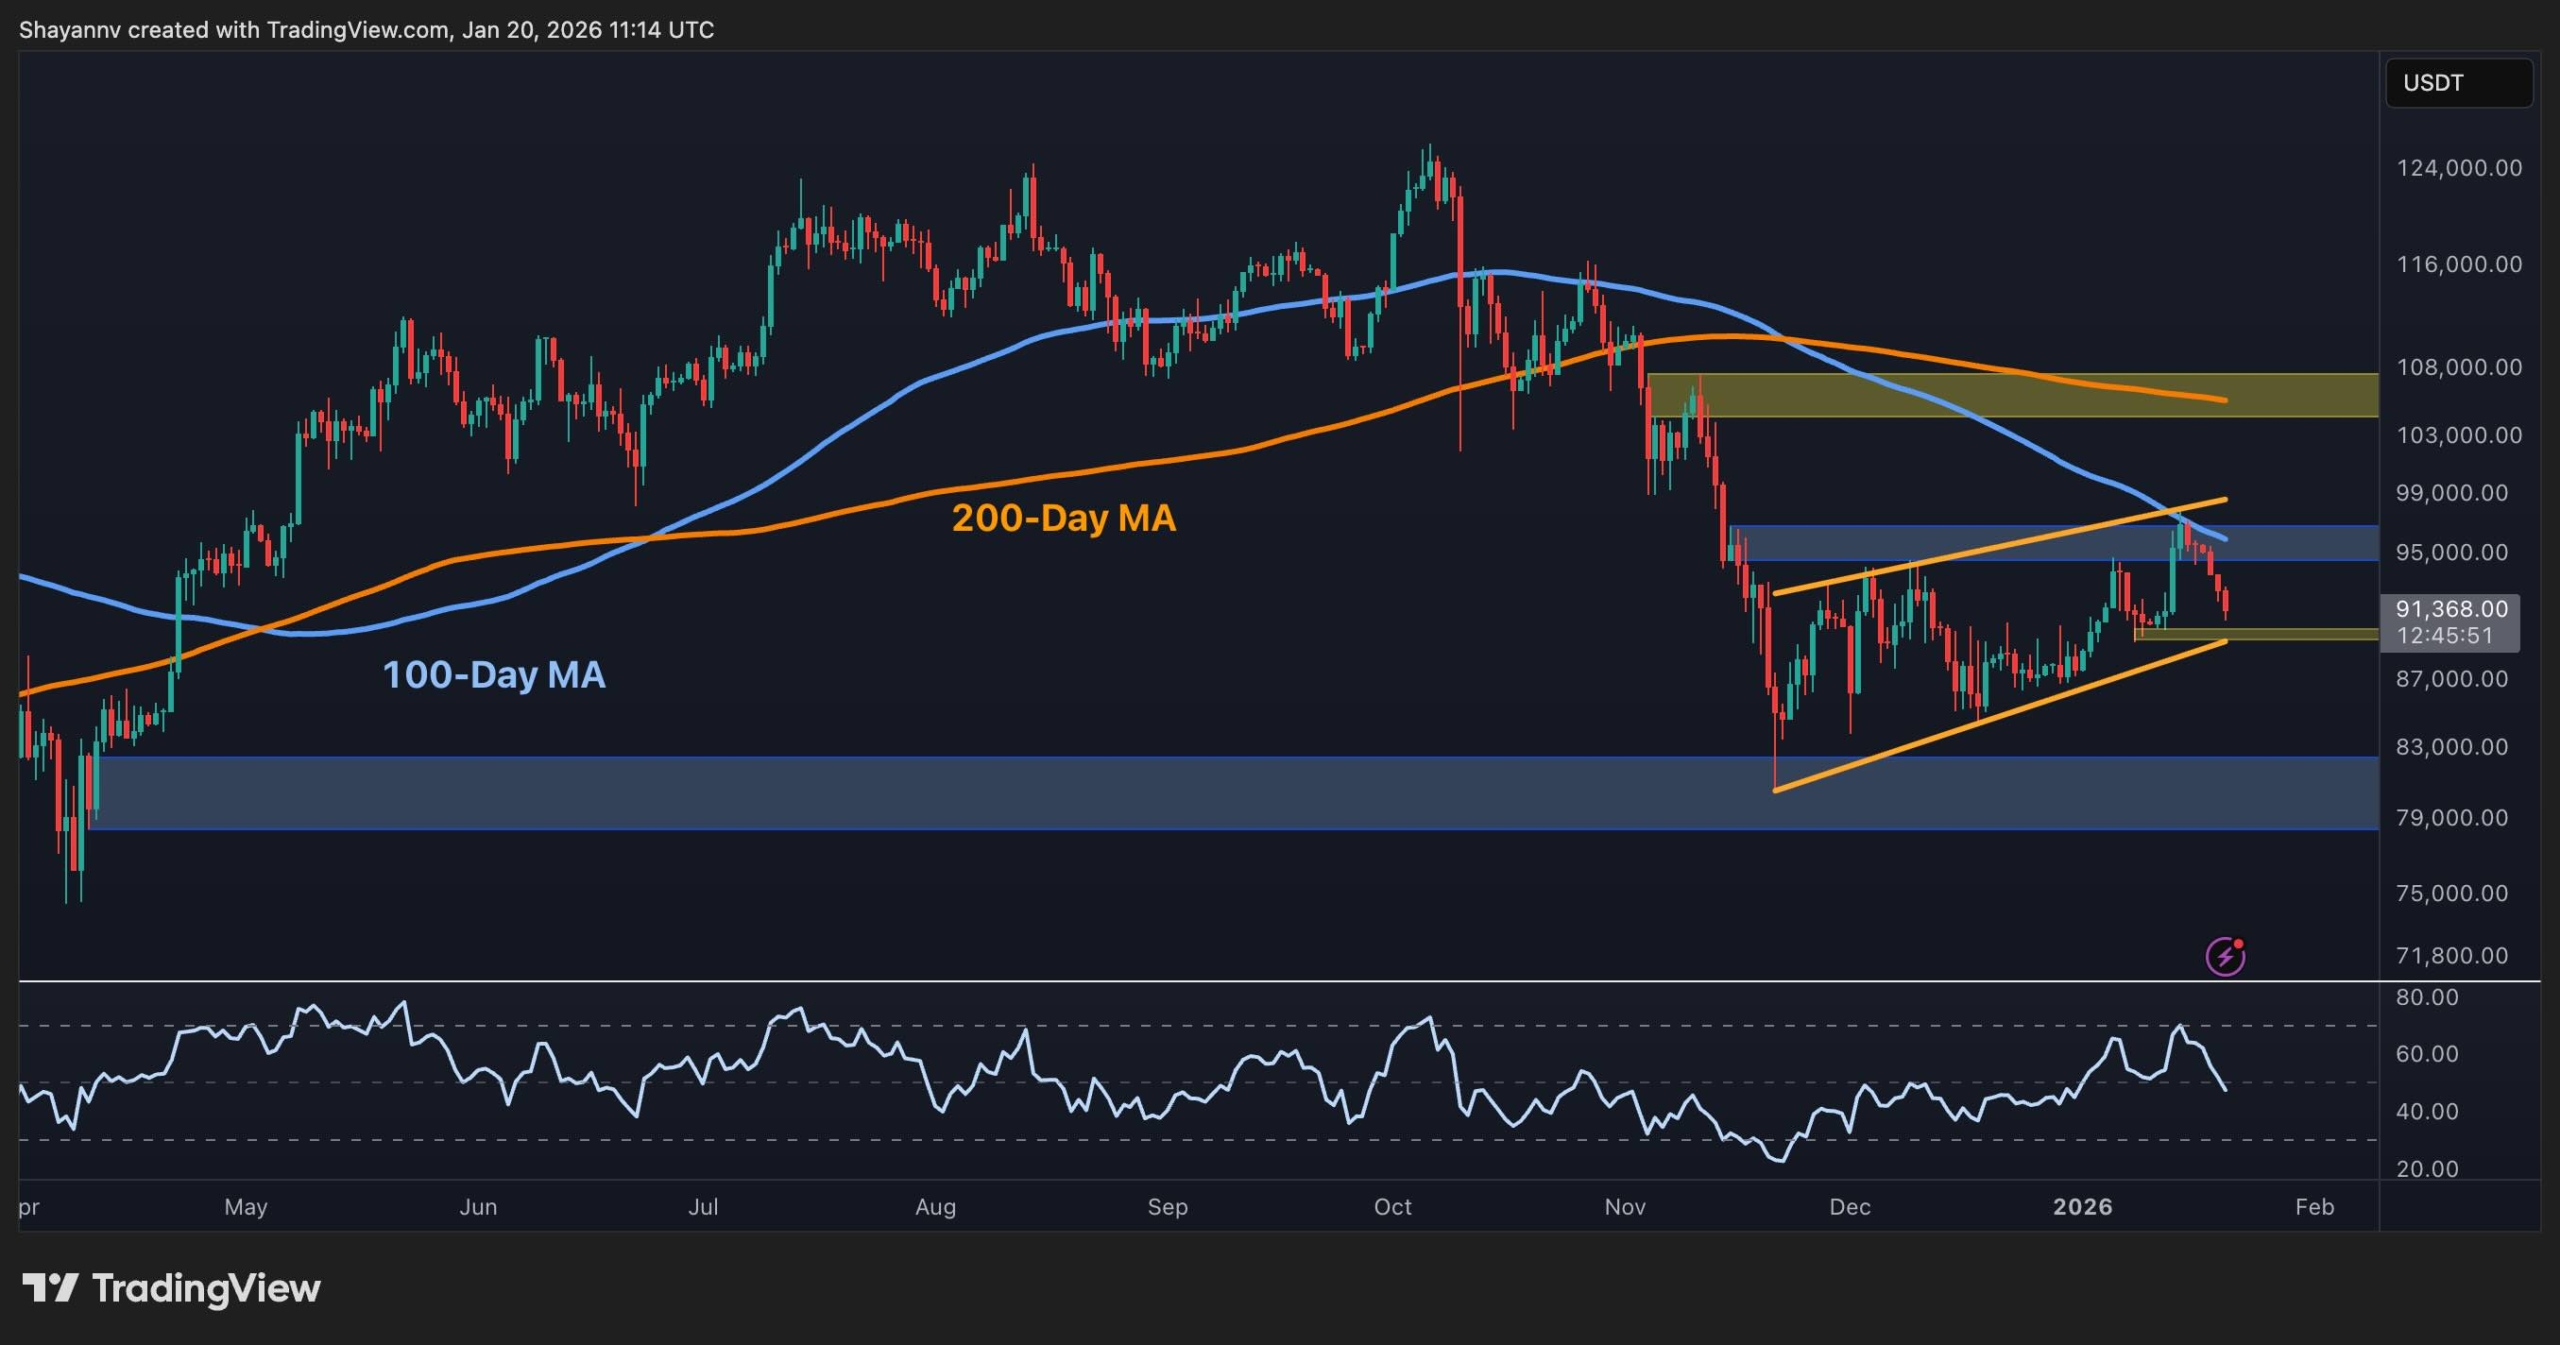
On the daily chart, Bitcoin has rolled over from the $98,000 resistance band, which coincides with the upper boundary of a rising channel structure and the vicinity of the 100-day moving average.

The 200-day moving average remains overhead and downward-sloping around $105,000, confirming that the broader medium-term trend is not yet fully realigned to the upside. The Daily RSI has also retreated from overbought territory and is dropping below the 50% threshold.

The first important support now sits in the $90,000 region, where the lower channel boundary and the recent bounce’s base overlap. Loss of this area on a closing basis would open the way toward the deeper demand block around $80,000, which marks the origin of the latest leg higher and the prior major accumulation zone. As long as price holds above $88,000 and reclaims the mid-$90,000s with conviction, the daily structure can still evolve into a constructive higher-low configuration, but sustained trade below $88,000 would significantly weaken that constructive bias.

btc_price_chart_2001261Source: TradingView

BTC/USDT 4-Hour Chart

The 4-hour chart shows the price is poised to test the lower boundary of the ascending channel. It has declined from the recent local high near $96,000 back into the $90,000–$91,000 area, where short-term support formed during the earlier consolidation.

The 4-hour RSI has also moved into oversold territory, signalling stretched downside momentum after several consecutive red candles.

If the lower boundary around $89,000–$90,000 holds, a technical rebound toward $93,000–$95,000 would be consistent with a standard retest of the broken intraday range and could help determine whether sellers retain control.

On the other hand, a clean break below $89,000 with would confirm a loss of the short-term up-channel and probably invite a deeper test of the high-timeframe demand zone around $80,000. At the moment, the intraday structure reflects corrective pressure within a broader consolidation band rather than a fully developed bearish trend.

btc_price_chart_2001262Source: TradingView

On-Chain Analysis

Short-term holder behaviour over recent months has been characterised by persistent loss realisation. The 30-day EMA of the short-term holder SOPR has spent an extended period below its neutral threshold around 1, indicating that coins held for a relatively short duration have been spent on average at a loss. This pattern suggests that late entrants and weaker hands have been continuously exiting during the consolidation phase, absorbing downside and sideways volatility instead of aggressively defending higher prices.

Historically, prolonged periods in which short-term holders realise losses while price holds above key higher-timeframe support are often associated with a “reset” of market positioning: speculative excess is reduced, ownership shifts toward stronger hands, and sensitivity to marginal new demand increases.

This dynamic does not guarantee immediate continuation, and if macro demand were to weaken further, the overhang of realised losses could still weigh on price. However, the combination of structural support holding on the chart and evidence of capitulation among shorter-term participants is consistent with a late-stage corrective environment that can, once selling pressure is exhausted, provide the foundation for a subsequent impulsive advance.

btc_sopr_chart_200126Source: CryptoQuant

The post Bitcoin Price Prediction: is BTC About to Plummet Below $90K This Week? appeared first on CryptoPotato.

Market Opportunity
Bitcoin Logo
Bitcoin Price(BTC)
$89,636.85
$89,636.85$89,636.85
-1.15%
USD
Bitcoin (BTC) Live Price Chart
Disclaimer: The articles reposted on this site are sourced from public platforms and are provided for informational purposes only. They do not necessarily reflect the views of MEXC. All rights remain with the original authors. If you believe any content infringes on third-party rights, please contact [email protected] for removal. MEXC makes no guarantees regarding the accuracy, completeness, or timeliness of the content and is not responsible for any actions taken based on the information provided. The content does not constitute financial, legal, or other professional advice, nor should it be considered a recommendation or endorsement by MEXC.

You May Also Like

BFX Presale Raises $7.5M as Solana Holds $243 and Avalanche Eyes $1B Treasury — Best Cryptos to Buy in 2025

BFX Presale Raises $7.5M as Solana Holds $243 and Avalanche Eyes $1B Treasury — Best Cryptos to Buy in 2025

BFX presale hits $7.5M with tokens at $0.024 and 30% bonus code BLOCK30, while Solana holds $243 and Avalanche builds a $1B treasury to attract institutions.
Share
Blockchainreporter2025/09/18 01:07
Tokyo’s Metaplanet Launches Miami Subsidiary to Amplify Bitcoin Income

Tokyo’s Metaplanet Launches Miami Subsidiary to Amplify Bitcoin Income

Metaplanet Inc., the Japanese public company known for its bitcoin treasury, is launching a Miami subsidiary to run a dedicated derivatives and income strategy aimed at turning holdings into steady, U.S.-based cash flow. Japanese Bitcoin Treasury Player Metaplanet Opens Miami Outpost The new entity, Metaplanet Income Corp., sits under Metaplanet Holdings, Inc. and is based […]
Share
Coinstats2025/09/18 00:32
Whales Dump 200 Million XRP in Just 2 Weeks – Is XRP’s Price on the Verge of Collapse?

Whales Dump 200 Million XRP in Just 2 Weeks – Is XRP’s Price on the Verge of Collapse?

Whales offload 200 million XRP leaving market uncertainty behind. XRP faces potential collapse as whales drive major price shifts. Is XRP’s future in danger after massive sell-off by whales? XRP’s price has been under intense pressure recently as whales reportedly offloaded a staggering 200 million XRP over the past two weeks. This massive sell-off has raised alarms across the cryptocurrency community, as many wonder if the market is on the brink of collapse or just undergoing a temporary correction. According to crypto analyst Ali (@ali_charts), this surge in whale activity correlates directly with the price fluctuations seen in the past few weeks. XRP experienced a sharp spike in late July and early August, but the price quickly reversed as whales began to sell their holdings in large quantities. The increased volume during this period highlights the intensity of the sell-off, leaving many traders to question the future of XRP’s value. Whales have offloaded around 200 million $XRP in the last two weeks! pic.twitter.com/MiSQPpDwZM — Ali (@ali_charts) September 17, 2025 Also Read: Shiba Inu’s Price Is at a Tipping Point: Will It Break or Crash Soon? Can XRP Recover or Is a Bigger Decline Ahead? As the market absorbs the effects of the whale offload, technical indicators suggest that XRP may be facing a period of consolidation. The Relative Strength Index (RSI), currently sitting at 53.05, signals a neutral market stance, indicating that XRP could move in either direction. This leaves traders uncertain whether the XRP will break above its current resistance levels or continue to fall as more whales sell off their holdings. Source: Tradingview Additionally, the Bollinger Bands, suggest that XRP is nearing the upper limits of its range. This often points to a potential slowdown or pullback in price, further raising concerns about the future direction of the XRP. With the price currently around $3.02, many are questioning whether XRP can regain its footing or if it will continue to decline. The Aftermath of Whale Activity: Is XRP’s Future in Danger? Despite the large sell-off, XRP is not yet showing signs of total collapse. However, the market remains fragile, and the price is likely to remain volatile in the coming days. With whales continuing to influence price movements, many investors are watching closely to see if this trend will reverse or intensify. The coming weeks will be critical for determining whether XRP can stabilize or face further declines. The combination of whale offloading and technical indicators suggest that XRP’s price is at a crossroads. Traders and investors alike are waiting for clear signals to determine if the XRP will bounce back or continue its downward trajectory. Also Read: Metaplanet’s Bold Move: $15M U.S. Subsidiary to Supercharge Bitcoin Strategy The post Whales Dump 200 Million XRP in Just 2 Weeks – Is XRP’s Price on the Verge of Collapse? appeared first on 36Crypto.
Share
Coinstats2025/09/17 23:42