

Polkadot (DOT) Price Prediction 2026, 2027-2030
- Bullish DOT price prediction for 2026 is $1.744 to $2.426.
- Polkadot (DOT) price might reach $10 soon.
- Bearish DOT price prediction for 2026 is $0.764.
In Polkadot (DOT) price prediction 2026, 2027-2030, we will analyze the price patterns of DOT by using accurate trader-friendly technical analysis indicators and predict the future movement of the cryptocurrency.
|
TABLE OF CONTENTS
|
|
INTRODUCTION
|
|
|
POLKADOT (DOT) PRICE PREDICTION 2026
|
|
| POLKADOT (DOT) PRICE PREDICTION 2026, 2027-2030 |
| CONCLUSION |
| FAQ |
Polkadot (DOT) Current Market Status
| Current Price | $1.26 |
| 24 – Hour Price Change | 0.76% Up |
| 24 – Hour Trading Volume | $113.83M |
| Market Cap | $2.12B |
| Circulating Supply | 1.68B DOT |
| All – Time High | $55.00 (Nov 04, 2021) |
| All – Time Low | $1.13 (On Feb 06 ,2026) |
What is Polkadot (DOT)
| TICKER | DOT |
| BLOCKCHAIN | Polkadot |
| CATEGORY | Web3 |
| LAUNCHED ON | May 2020 |
| UTILITIES | Governance, security, gas fees & rewards |
Polkadot (DOT) is the native cryptocurrency of the Polkadot ecosystem. Polkadot is a multi-chain blockchain ecosystem home to a network of interoperable sharded blockchains, and parachains..
DOT is primarily used as network fees and grants governance rights to the holders. Furthermore, the Polkadot ecosystem comprises a core network, relay chain, and several parachains. The blockchain utilizes the nominated proof-of-stake (NPoS) consensus to secure the transactions of the blockchain.
Polkadot 24H Technicals
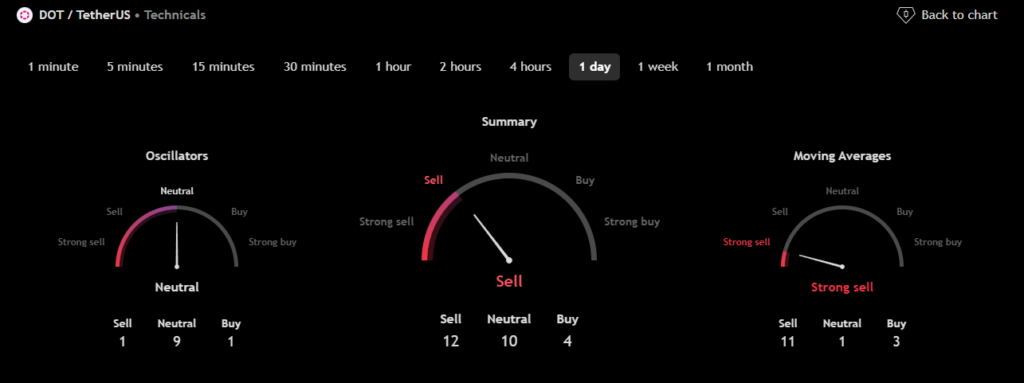 (Source: TradingView)
Polkadot (DOT) Price Prediction 2026
Polkadot (DOT) ranks 37th on CoinMarketCap in terms of its market capitalization. The overview of the Polkadot price prediction for 2026 is explained below with a daily time frame.
In the above chart, Polkadot (DOT) laid out a Horizontal channel pattern. The Horizontal channel pattern is also known as the sideways trend. In general, the horizontal channel is formed during the price consolidation. In this pattern, the upper trendline, the line that connects the highs, and the lower trendline, the line that connects the lows, run horizontally parallel, and the price action is contained within it.
A horizontal channel is often regarded as one of the suitable patterns for timing the market, as the buying and selling points are in consolidation.
At the time of analysis, the price of Polkadot (DOT) was recorded at $1.26. If the pattern trend continues, then the price of DOT might reach the resistance levels of $1.752 and $2.489. If the trend reverses, then the price of DOT may fall to the support of $1.446 and $1.214.
Polkadot (DOT) Resistance and Support Levels
The chart given below elucidates the possible resistance and support levels of Polkadot (DOT) in 2026.
From the above chart, we can analyze and identify the following as the resistance and support levels of Polkadot (DOT) for 2026.
| Resistance Level 1 | $1.744 |
| Resistance Level 2 | $2.426 |
| Support Level 1 | $1.108 |
| Support Level 2 | $0.764 |
Polkadot (DOT) Price Prediction 2026 — RVOL, MA, and RSI
The technical analysis indicators such as Relative Volume (RVOL), Moving Average (MA), and Relative Strength Index (RSI) of Polkadot (DOT) are shown in the chart below.
From the readings on the chart above, we can make the following inferences regarding the current Polkadot (DOT) market in 2026.
| INDICATOR | PURPOSE | READING | INFERENCE |
| 50-Day Moving Average (50MA) | Nature of the current trend by comparing the average price over 50 days | 50 MA = $1.481 Price = $1.545 (50MA < Price) |
Bullish/Uptrend |
| Relative Strength Index (RSI) | Magnitude of price change;Analyzing oversold & overbought conditions | 67.866 <30 = Oversold 50-70 = Neutral >70 = Overbought |
Neutral |
| Relative Volume (RVOL) | Asset’s trading volume in relation to its recent average volumes | Below cutoff line | Weak Volume |
Polkadot (DOT) Price Prediction 2026 — ADX, RVI
In the below chart, we analyze the strength and volatility of Polkadot (DOT) using the following technical analysis indicators — Average Directional Index (ADX) and Relative Volatility Index (RVI).
From the readings on the chart above, we can make the following inferences regarding the price momentum of Polkadot (DOT).
| INDICATOR | PURPOSE | READING | INFERENCE |
| Average Directional Index (ADX) | Strength of the trend momentum | 6.728 | Very Weak Trend |
| Relative Volatility Index (RVI) | Volatility over a specific period | 48.90 <50 = Low >50 = High |
Low Volatility |
Comparison of DOT with BTC, ETH
Let us now compare the price movements of Polkadot (DOT) with that of Bitcoin (BTC), and Ethereum (ETH).
From the above chart, we can interpret that the price action of DOT is similar to that of BTC and ETH. That is, when the price of BTC and ETH increases or decreases, the price of DOT also increases or decreases respectively.
Polkadot (DOT) Price Prediction 2027, 2028 – 2030
With the help of the aforementioned technical analysis indicators and trend patterns, let us predict the price of Polkadot (DOT) between 2027, 2028, 2029, and 2030.
| Year | Bullish Price | Bearish Price |
| Polkadot (DOT) Price Prediction 2027 | $15 | $1.5 |
| Polkadot (DOT) Price Prediction 2028 | $20 | $1.3 |
| Polkadot (DOT) Price Prediction 2029 | $25 | $1.1 |
| Polkadot (DOT) Price Prediction 2030 | $30 | $0.9 |
Conclusion
If Polkadot (DOT) establishes itself as a good investment in 2026, this year would be favorable to the cryptocurrency. In conclusion, the bullish Polkadot (DOT) price prediction for 2026 is $2.426. Comparatively, the bearish Polkadot (DOT) price prediction for 2026 is $0.764.
If there is a positive elevation in the market momentum and investors’ sentiment, then Polkadot (DOT) might hit $10. Furthermore, with future upgrades and advancements in the Polkadot ecosystem, DOT might surpass its current all-time high (ATH) of $55.00 and mark its new ATH.
FAQ
1. What is Polkadot (DOT)?
Polkadot (DOT) is the native cryptocurrency of the Polkadot ecosystem. Polkadot is a multi-chain blockchain ecosystem home to a network of interoperable sharded blockchains, parachains.
2. Where can you buy Polkadot (DOT)?
Polkadot (DOT) has been listed on many crypto exchanges which include Binance, OKX, Deepcoin, Bybit, and Cointr Pro.
3. Will Polkadot (DOT) record a new ATH soon?
With the ongoing developments and upgrades within the Polkadot platform, Polkadot (DOT) has a high possibility of reaching its ATH soon.
4. What is the current all-time high (ATH) of Polkadot (DOT)?
Polkadot (DOT) hit its current all-time high (ATH) of $55.00 on Nov 04, 2021.
5. What is the lowest price of Polkadot (DOT)?
According to CoinMarketCap, DOT hit its all-time low (ATL) of $1.13 on February 06, 2026
6. Will Polkadot (DOT) hit $10?
If Polkadot (DOT) becomes one of the active cryptocurrencies that majorly maintain a bullish trend, it might rally to hit $10 soon.
7. What will be the Polkadot (DOT) price by 2027?
Polkadot (DOT) price might reach $15 by 2027.
8. What will be the Polkadot (DOT) price by 2028?
Polkadot (DOT) price might reach $20 by 2028.
9. What will be the Polkadot (DOT) price by 2029?
Polkadot (DOT) price might reach $25 by 2029.
10. What will be the Polkadot (DOT) price by 2030?
Polkadot (DOT) price might reach $30 by 2030.
Top Crypto Predictions
Avalanche (AVAX) Price Prediction
Cosmos (ATOM) Price Prediction
Ondo (ONDO) Price Prediction
Disclaimer: The opinion expressed in this article is solely the author’s. It does not represent any investment advice. TheNewsCrypto team encourages all to do their own research before investing.


You May Also Like

Japanese Gen Z Fears Crypto Scams More Than Any Other Generation

Gaming Groups Push Senate to Ban Sports Prediction Markets in Crypto Bill

Circle (CRCL) Launches cirBTC Wrapped Bitcoin Targeting Institutional Users


