

Sonic price struggles at $0.07 as low volume signals breakdown risk
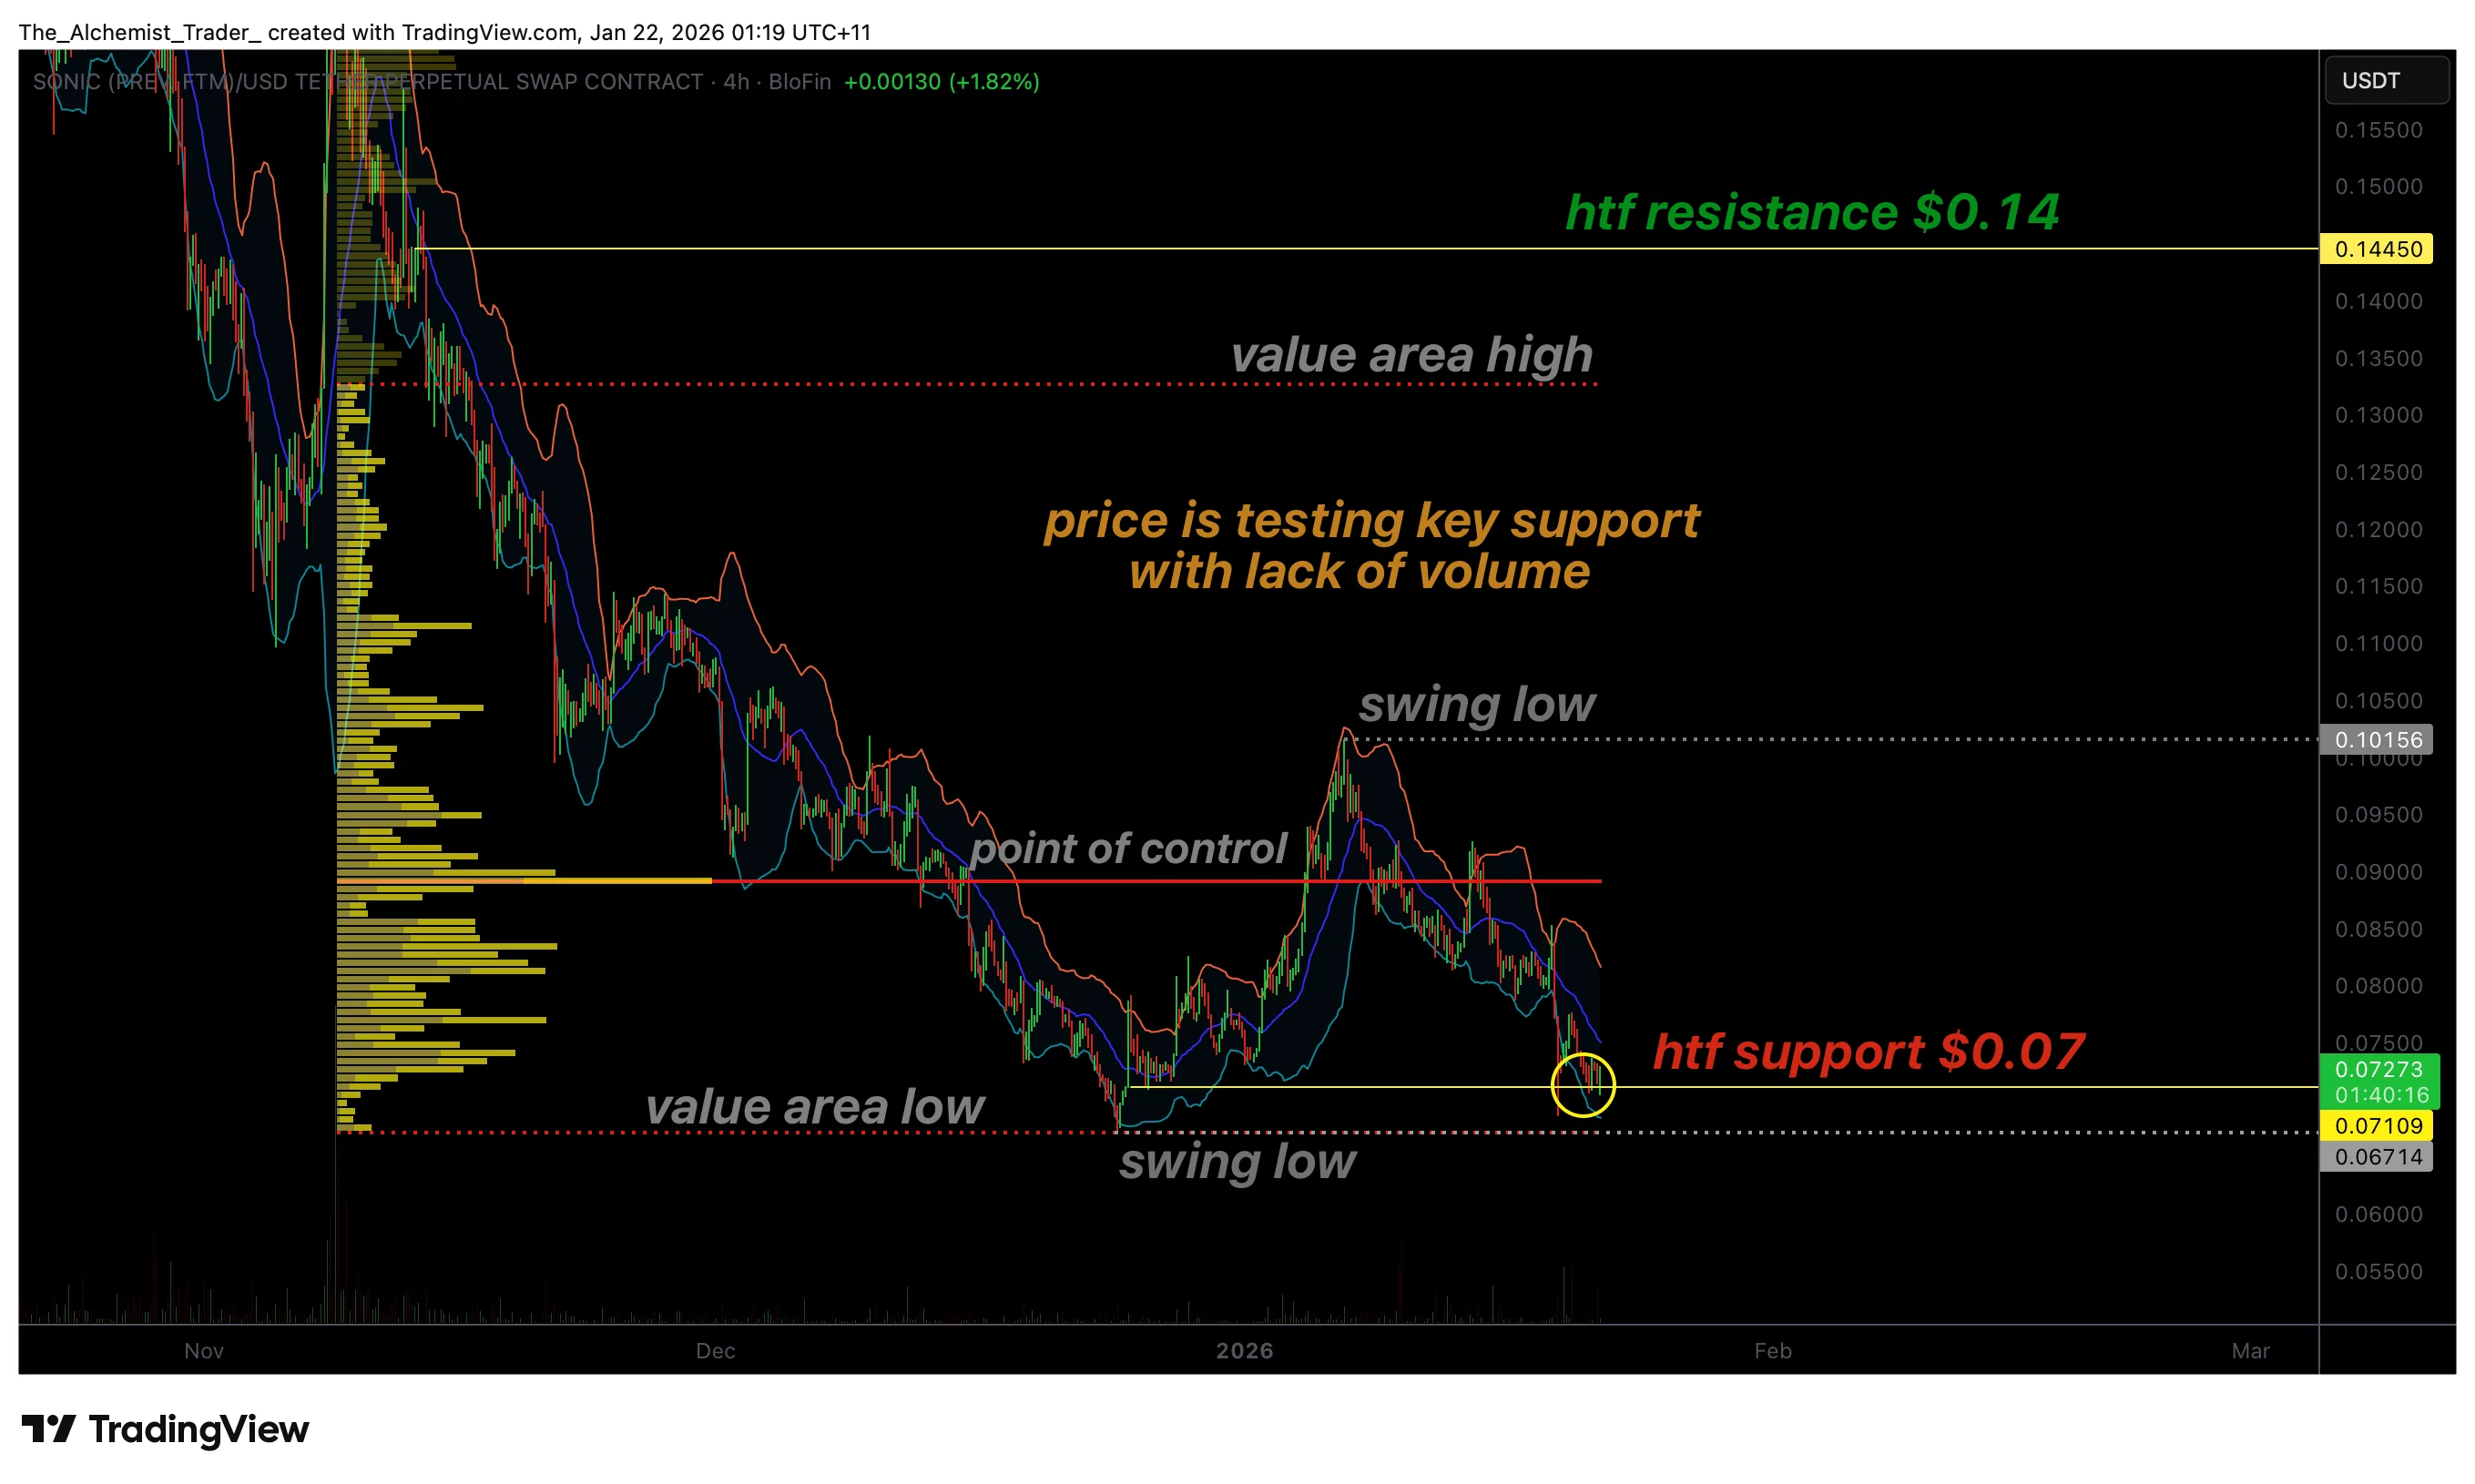
Sonic price is grinding at $0.07 high-time-frame support with weak volume, increasing breakdown risk, and raising the probability of a fresh yearly low if demand doesn’t step in.
- Sonic remains in a macro downtrend after losing the Point of Control
- $0.07 support is the key level, but bullish demand is weak
- Low volume increases probability of a breakdown into new yearly lows
Sonic (S) price is continuing to show clear weakness, as it remains trapped in a persistent downtrend and struggles to build meaningful recovery momentum. Since losing the Point of Control (POC), Sonic has maintained a bearish structure with sellers controlling rallies and price consistently failing to reclaim key value levels.
The result has been a slow but relentless decline into a major high-time-frame support region near $0.07.
Sonic price key technical points
- Sonic remains in a macro downtrend after losing the Point of Control
- $0.07 is the key high-time-frame support holding price for now
- Weak volume around support increases breakdown risk and raises yearly-low probability
The $0.07 level is now the most important zone on Sonic’s chart. This is the region that previously produced a bounce and served as a major demand area. Because it has already been tested historically, the market expects some reaction here again.
However, support levels don’t remain strong forever. Each time a support level is tested, it can weaken as liquidity is consumed and buyers become less aggressive. If Sonic continues to close around $0.07 without building upward momentum, the probability increases that support will eventually fail.
From a technical standpoint, $0.07 serves as the final structural defense before Sonic could break into new yearly lows. If this level fails on a closing basis, the next move is likely to accelerate lower due to stop-loss liquidity sitting beneath the swing lows.
Why low Volume is the biggest warning sign
Volume behavior is one of the most important signals to assess when price is trading at support. A strong support zone is usually accompanied by clear demand—buyers stepping in with urgency and pushing price higher with momentum.
In Sonic’s case, the market is showing the opposite. While price is hovering at $0.07, bullish volume remains weak and inconsistent. This is important because low volume support reactions suggest a lack of commitment from buyers.
When buyers are unwilling to defend a support zone aggressively, it becomes easier for sellers to push price lower. This creates the conditions for a breakdown, especially if the broader market remains risk-off or if Sonic continues trading below key value levels without reclaiming momentum.
The repeated candle closes around support without volume expansion indicate that Sonic is not absorbing selling pressure strongly enough to force a reversal.
Break below $0.07 could trigger a new yearly low
If Sonic loses the $0.07 high-time-frame support, the probability of printing a new yearly low increases sharply. This would confirm continued bearish expansion and reinforce the macro downtrend structure.
Breakdowns from major support levels often happen quickly once the market begins accelerating. That is because liquidity builds beneath the level, and once it breaks, stop losses and sell pressure can cause a sharp flush lower.
With Sonic already in a weak trend and volume failing to show a bullish recovery, the downside scenario remains active. A breakdown would not only mark a structural failure but also shift market sentiment further bearish, as traders adjust to a new, lower price regime.
What would improve the outlook?
For Sonic to invalidate the breakdown risk, the market needs to show clear signs of demand. This would include:
- a strong bullish reaction candle from $0.07
- rising volume inflows during the bounce
- reclaiming key resistance levels on a closing basis
- holding higher lows and shifting structure upward
Without those conditions, any bounce is likely to remain corrective and vulnerable to being sold into.
What to expect in the coming price action
Sonic remains in a vulnerable position, as price struggles to hold $0.07, a key high-time-frame support level, while bullish volume remains weak. The lack of follow-through on recovery attempts indicates that demand remains limited, increasing the risk of a breakdown if sellers maintain pressure.
As long as Sonic continues closing near support without a meaningful rise in volume, downside risk remains elevated. A confirmed break below $0.07 could trigger a fast move into new yearly lows, reinforcing the macro bearish structure.


You May Also Like

XRP In a Level Playing Field With FedNow and ISO 20022, Says Researcher With Proof

Crypto Market Drops as Fear Grows and Major Assets Decline


