Ethereum price dropped below $2,900 for the first time in 5 weeks as recent geopolitical concerns drove investors away from the crypto market. According to dataEthereum price dropped below $2,900 for the first time in 5 weeks as recent geopolitical concerns drove investors away from the crypto market. According to data

Ethereum price risks crash as it confirms bearish pennant pattern amid ETF outflows

2026/01/22 20:02
3 min read
For feedback or concerns regarding this content, please contact us at [email protected]

Ethereum price dropped below $2,900 for the first time in 5 weeks as recent geopolitical concerns drove investors away from the crypto market.

Summary
  • Ethereum price briefly fell to a 5-week low of $2,872 on Thursday.
  • Geopolitical concerns and consecutive outflows from ETFs impacted market sentiment.
  • A bearish pennant pattern was confirmed on the daily chart.

According to data from crypto.news, Ethereum (ETH) fell to an intraday low of $2,872 on Thursday morning Asian time after it lost the key $3,000 pyscologcial support level earlier on Tuesday.

Ethereum price dropped because investors had turned risk-averse after U.S. President Donald Trump threatened to impose tariffs on eight NATO allies if they did not cede or sell Greenland to the United States. Over the last few trading sessions, Investors were seen moving to safe-haven assets such as Gold and Silver as they awaited the macro environment to cool off. 

Adding to this, a drop in institutional demand for Ethereum was also impacting retail sentiment. Data compiled by SoSovalue showed that investors had pulled out over $500 million from U.S. spot Ethereum ETFs over the past two days, an outflow trend not observed since mid-December last year.

A decline in institutional demand has often acted as a bearish catalyst for Ethereum, as seen earlier on Dec. 18 last year, where sustained outflows from major funds led the Ethereum price to drop by nearly 8% in a single week.

Ethereum price risks drop to $2,500

On the daily chart, Ethereum price has confirmed a bearish pennant pattern that had formed since early October last year. The pattern is formed when an asset’s price drops sharply, forming the flagpole, and is followed by a small, triangular consolidation area called the pennant. 

Ethereum price has confirmed a bearish pennant pattern on the daily chart.

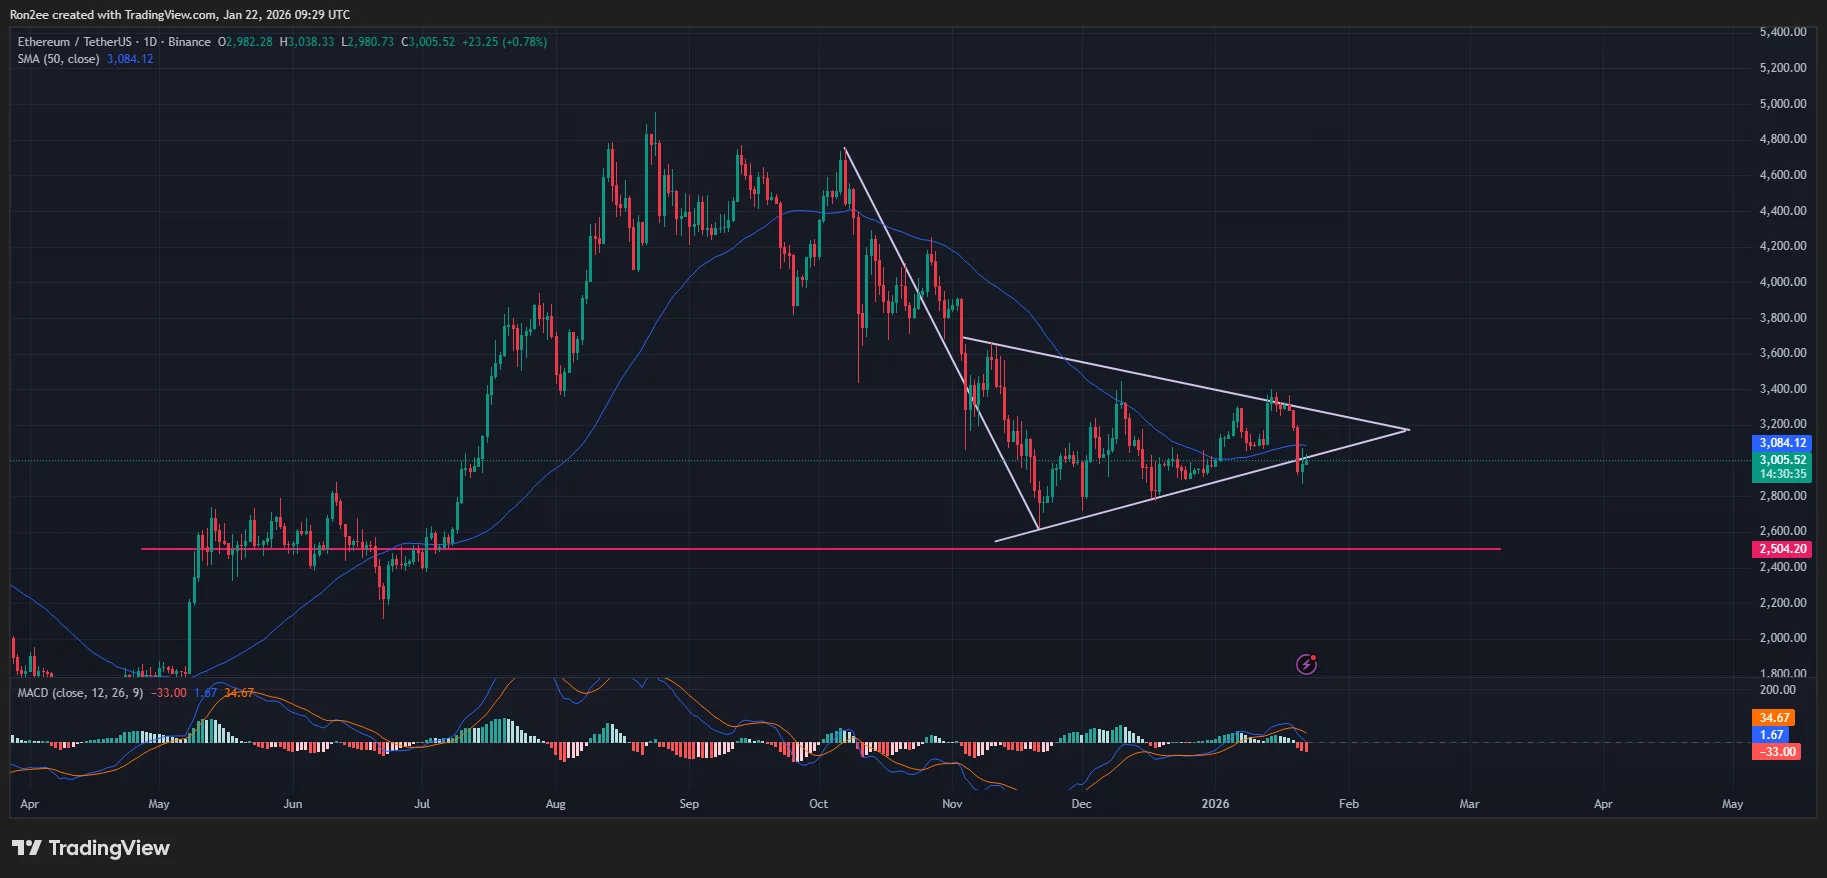
Traders typically enter a short position after the price decisively breaks the lower trendline of the pennant, as was the case for Ethereum price action.

Ethereum has also fallen below the 50-day SMA at $3,084, which has been acting as a dynamic level of resistance for the asset over recent weeks. Furthermore, the MACD lines have confirmed a bearish crossover, providing another sell signal for traders looking for momentum shifts.

Put together, these bearish indicators suggest that Ethereum could fall by 17% to $2,500, which is the next psychological support level, that has acted as a strong floor for the cryptocurrency during a volatile period in Q2 2025.

ETH price could recover as macro tensions ease

At the time of publication, the leading altcoin by market cap had managed to recover back above the $3,000 mark, supported by news that Trump has decided not to move forward with the tariffs after a “very productive meeting” with NATO Secretary General Mark Rutte in Davos

This development may provide temporary relief for Ethereum and could help fuel a recovery, especially if it manages to hold above $3,000. 

Subsequently, a move back above $3,084 would invalidate the bearish forecast.

Disclaimer: The articles reposted on this site are sourced from public platforms and are provided for informational purposes only. They do not necessarily reflect the views of MEXC. All rights remain with the original authors. If you believe any content infringes on third-party rights, please contact [email protected] for removal. MEXC makes no guarantees regarding the accuracy, completeness, or timeliness of the content and is not responsible for any actions taken based on the information provided. The content does not constitute financial, legal, or other professional advice, nor should it be considered a recommendation or endorsement by MEXC.

You May Also Like

RWAs Will Run on Two Blockchain Rails, Says Redstone Co-Founder

RWAs Will Run on Two Blockchain Rails, Says Redstone Co-Founder

The post RWAs Will Run on Two Blockchain Rails, Says Redstone Co-Founder appeared on BitcoinEthereumNews.com. Institutional adoption of real-world assets (RWAs)
Share
BitcoinEthereumNews2026/03/10 12:01
Edges higher ahead of BoC-Fed policy outcome

Edges higher ahead of BoC-Fed policy outcome

The post Edges higher ahead of BoC-Fed policy outcome appeared on BitcoinEthereumNews.com. USD/CAD gains marginally to near 1.3760 ahead of monetary policy announcements by the Fed and the BoC. Both the Fed and the BoC are expected to lower interest rates. USD/CAD forms a Head and Shoulder chart pattern. The USD/CAD pair ticks up to near 1.3760 during the late European session on Wednesday. The Loonie pair gains marginally ahead of monetary policy outcomes by the Bank of Canada (BoC) and the Federal Reserve (Fed) during New York trading hours. Both the BoC and the Fed are expected to cut interest rates amid mounting labor market conditions in their respective economies. Inflationary pressures in the Canadian economy have cooled down, emerging as another reason behind the BoC’s dovish expectations. However, the Fed is expected to start the monetary-easing campaign despite the United States (US) inflation remaining higher. Investors will closely monitor press conferences from both Fed Chair Jerome Powell and BoC Governor Tiff Macklem to get cues about whether there will be more interest rate cuts in the remainder of the year. According to analysts from Barclays, the Fed’s latest median projections for interest rates are likely to call for three interest rate cuts by 2025. Ahead of the Fed’s monetary policy, the US Dollar Index (DXY), which tracks the Greenback’s value against six major currencies, holds onto Tuesday’s losses near 96.60. USD/CAD forms a Head and Shoulder chart pattern, which indicates a bearish reversal. The neckline of the above-mentioned chart pattern is plotted near 1.3715. The near-term trend of the pair remains bearish as it stays below the 20-day Exponential Moving Average (EMA), which trades around 1.3800. The 14-day Relative Strength Index (RSI) slides to near 40.00. A fresh bearish momentum would emerge if the RSI falls below that level. Going forward, the asset could slide towards the round level of…
Share
BitcoinEthereumNews2025/09/18 01:23
Pi Network Accelerates: The Rapid Growth of the Pi Coin Ecosystem Could Transform Global Digital Transactions

Pi Network Accelerates: The Rapid Growth of the Pi Coin Ecosystem Could Transform Global Digital Transactions

    Pi Network Accelerates: The Rapid Growth of the Pi Coin Ecosystem Could Transform Global Digital Transactions
Share
Hokanews2026/03/10 12:06