

SUI Price Is Reaching a Point That Can’t Be Ignored After Weeks Of Decline
SUI price has spent the last few weeks drifting lower, frustrating anyone watching the chart closely. Each small bounce faded quickly, and sellers kept control of the bigger picture. That slow grind lower has now pushed SUI price into a zone that matters, and the chart is starting to hint that something different could be forming.
Over the last 17 days alone, SUI price has dropped by more than 30%. That kind of move usually leaves a clear emotional footprint on the chart, especially when price approaches levels where buyers previously stepped in with confidence. That moment is getting closer.
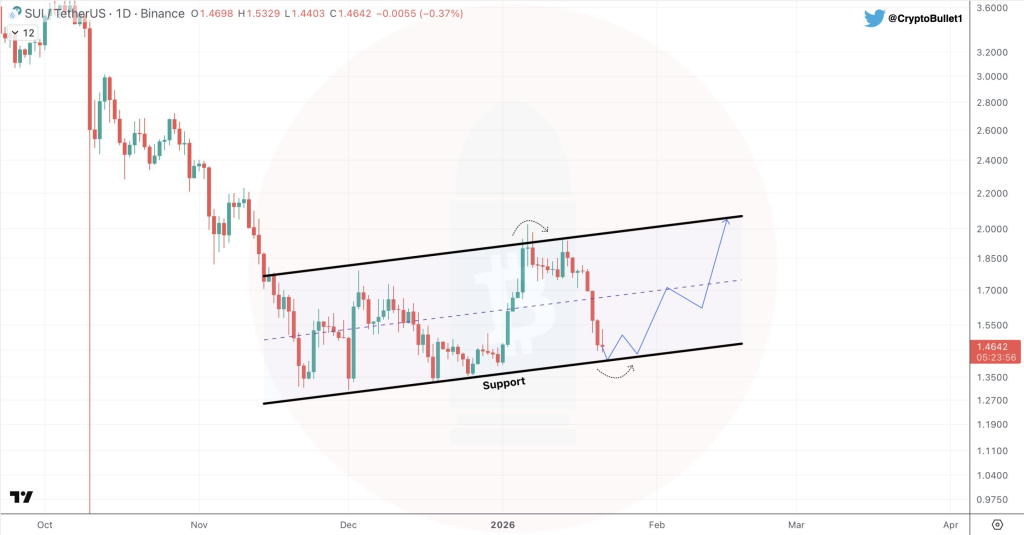
A tweet from a crypto analyst, Sui Insiders, has pointed out that SUI price is now back at daily support. That observation aligns with what the chart shows, as price sits near the lower channel boundary where buyers previously became active.
Current price action shows SUI price sliding back toward a zone where liquidity was absorbed in the past. That same area previously acted as a base before sharp upside moves. Price returning to such levels often forces the market to make a decision, either defending support again or breaking lower with momentum.
 @SuiInsiders / X
The chart shows a potential bounce scenario toward $2.05, which aligns with the channel top. That target sits near the upper trendline, where price has been rejected multiple times before.
The attached chart helps visualize this setup clearly. SUI price is compressing near support, while the channel structure remains intact.
Price action shows long lower wicks forming near support, suggesting buyers are reacting even while the broader trend remains weak. That reaction alone does not confirm a reversal, yet it shows that sellers are no longer moving price freely.
SUI Indicators Still Point To Bearish Conditions Despite Support Holding
Technical indicators are still flashing caution across the board. Most momentum and trend indicators remain firmly in sell territory. That situation might look discouraging on the surface, yet indicators tend to lag price, especially during potential transition phases.
Price action remains the most real time signal, and it often shifts before indicators follow. That is why support reactions deserve attention even when indicators stay bearish.
Technical Indicator Snapshot For SUI
| Name | Value | Action |
|---|---|---|
| RSI(14) | 38.748 | Momentum remains weak, showing sellers still control strength levels |
| STOCH(9,6) | 20.492 | Oversold conditions persist without a confirmed reversal signal |
| MACD(12,26) | -0.023 | Trend momentum continues pointing lower with no bullish crossover |
| ADX(14) | 49.664 | Strong trend strength favors the existing bearish direction |
| ROC | -17.129 | Rate of change confirms negative momentum remains dominant |
These readings explain why caution still matters here. Indicators are not yet supporting a bullish shift, even though price is reacting at support.
Why Price Action Alone Is Not Enough To Call A Reversal For SUI
Price action offers valuable clues, yet relying on it alone carries risk. Strong reversals usually come with confirmation from multiple signals, including pattern development and improving indicator behavior. Waiting for signs such as higher lows, volume expansion, or indicator stabilization often reduces false signals.
Read Also: Here’s the TAO Price If Bittensor Becomes the Backbone of Onchain AI
Support holds can fail, especially when broader market pressure remains heavy. A clean break below current support could open the door to deeper downside and shift the entire structure lower.
For now, SUI price sits at a crossroads. Support is being tested, indicators remain bearish, and the chart is asking an important question. The next reaction should reveal whether this level becomes a base or simply another pause before continuation.
Subscribe to our YouTube channel for daily crypto updates, market insights, and expert analysis.
The post SUI Price Is Reaching a Point That Can’t Be Ignored After Weeks Of Decline appeared first on CaptainAltcoin.


You May Also Like

Will Ethereum Foundation’s latest $48.9M move fuel more selling pressure ahead?

Dogecoin Price Review: Can DOGE Reclaim $0.20?


