

Dash price rallies as fibonacci support holds: Is a new yearly high next?
Dash price is bouncing from key Fibonacci support near $60, and if momentum holds, bulls may be positioning for a renewed rally toward the $97 yearly high.
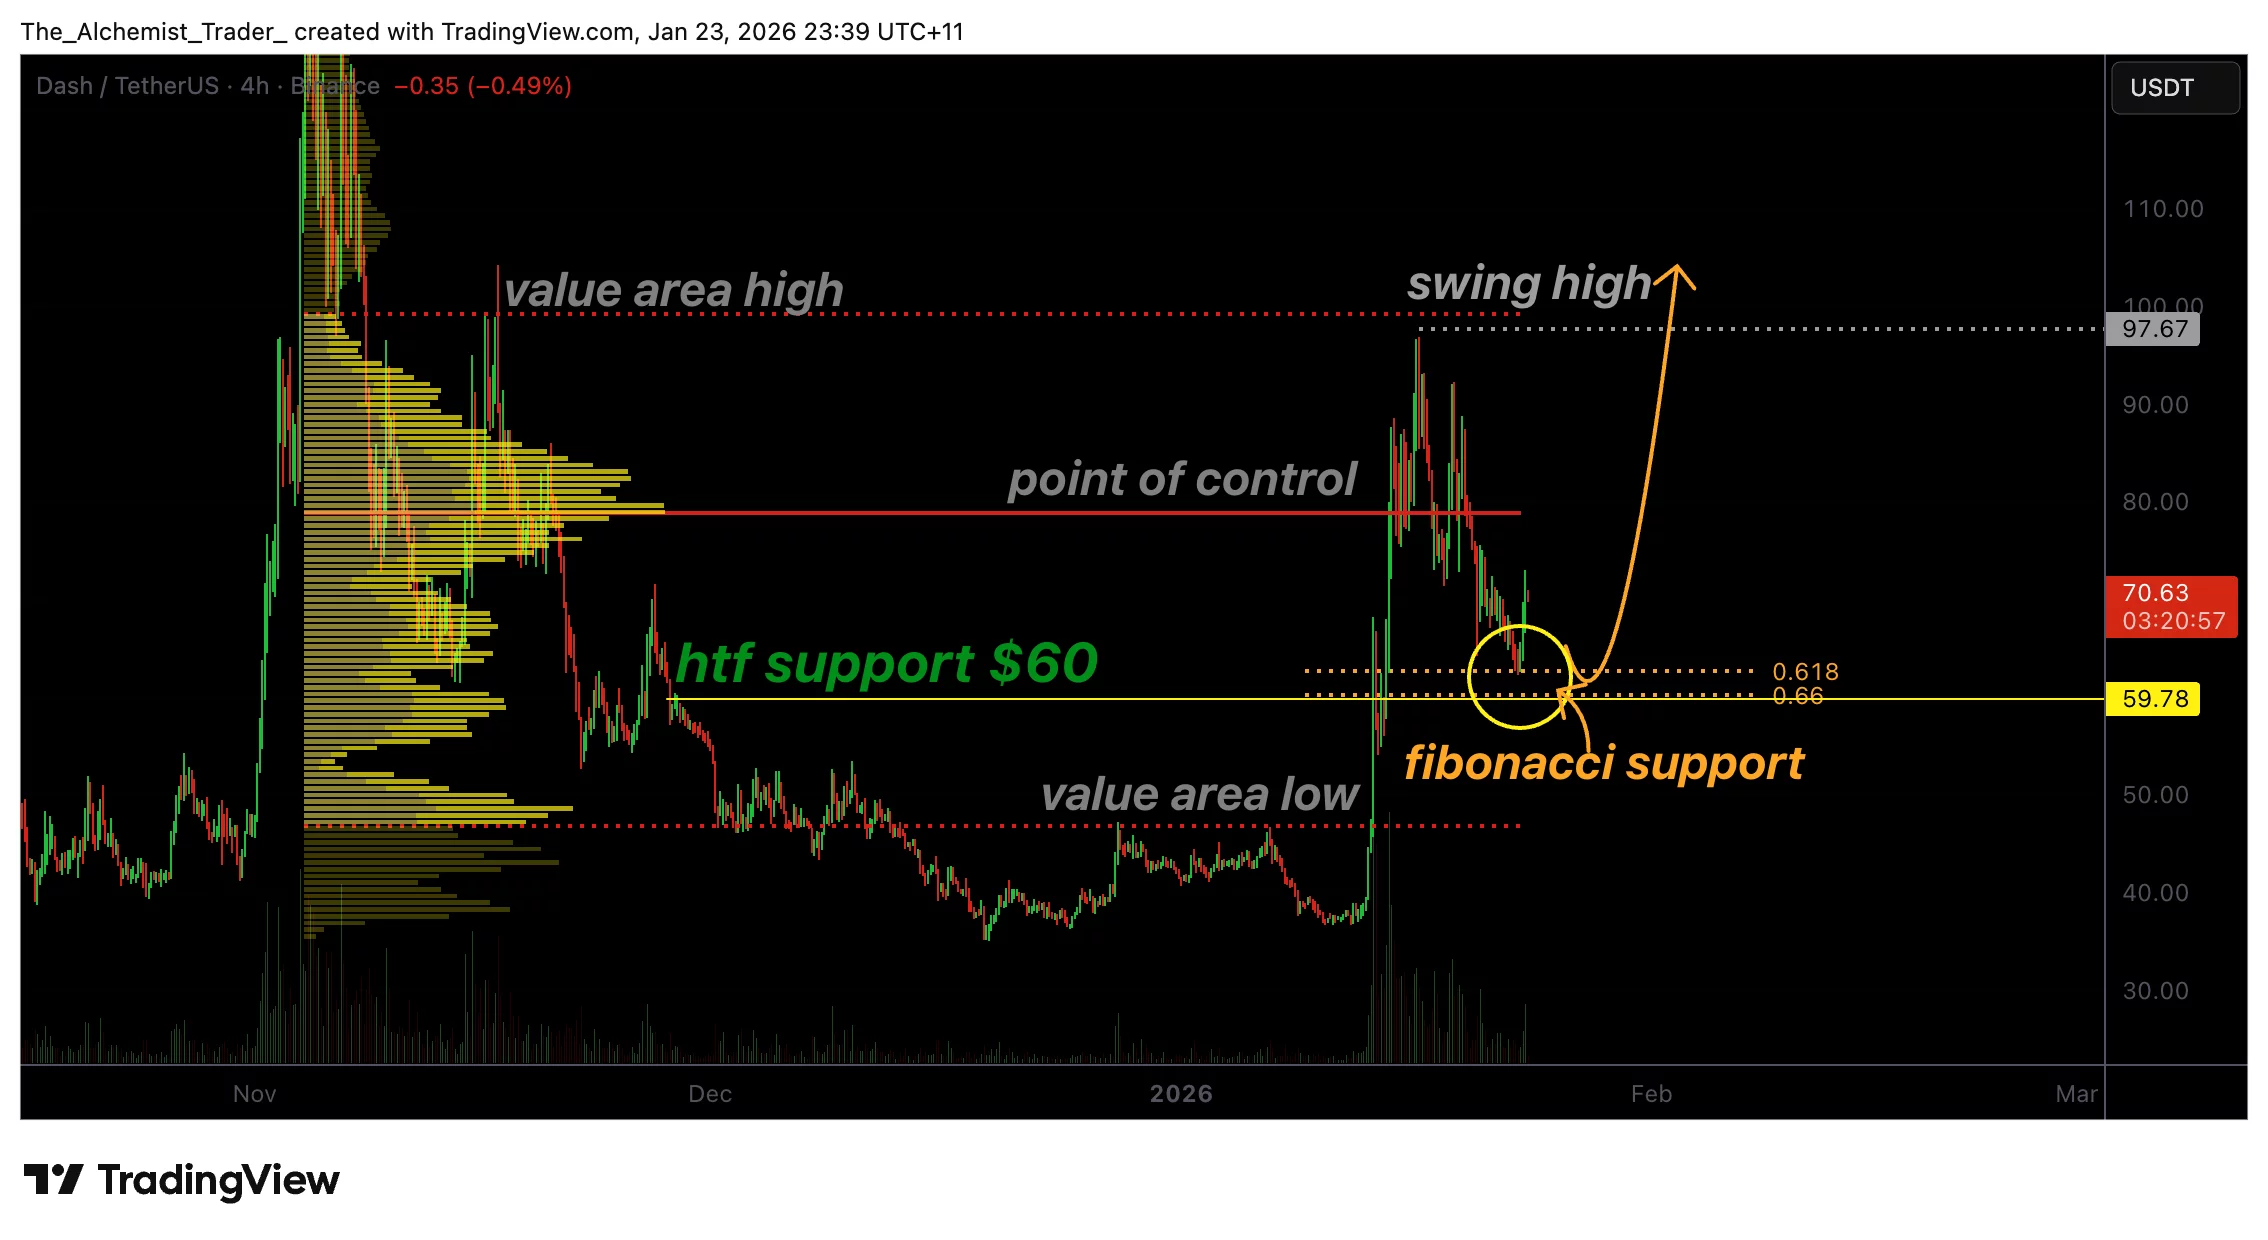
- Dash found support at the 0.618 Fibonacci level between $60 and $62.
- Daily support near $59 adds strong technical confluence.
- Continued volume expansion could fuel a rally toward the $97 yearly high.
Dash (DASH) price has entered a technically important phase after undergoing a corrective pullback from its recent impulsive rally. Following a strong advance that set a yearly high near $97, price action cooled off and retraced lower in a controlled manner. This pullback has now found support at a high-confluence technical zone, raising the possibility that Dash is preparing for another leg higher.
With buyers stepping in and volume beginning to respond, the focus shifts to whether this support can hold and fuel a continuation toward the highs.
Dash price key technical points
- 0.618 Fibonacci support holds near $60–62: A historically strong retracement level attracting buyers.
- Daily support adds confluence: The $59 region strengthens the probability of a sustained bounce.
- Volume response is critical: Continued volume expansion is needed to target $97 and beyond.
Dash’s recent market structure remains constructive despite the pullback. The rally that carried price toward $97 was impulsive in nature, signaling strong bullish participation. Importantly, the subsequent move lower has been corrective rather than impulsive, suggesting profit-taking rather than aggressive distribution.
Corrective retracements are a natural part of trending markets. They allow price to reset momentum, rebalance liquidity, and attract fresh buyers at discounted levels. In Dash’s case, the correction has unfolded cleanly into a textbook Fibonacci retracement zone.
Fibonacci support draws demand
The 0.618 Fibonacci retracement, located between $60 and $62, has emerged as the primary support area. This level is widely followed by market participants and often acts as a decision point during pullbacks in bullish trends. Price reaction from this zone has been constructive, with Dash stabilizing and beginning to push higher.
Adding to the significance of this area is the presence of daily support near $59, creating a strong zone of technical confluence. When multiple support signals align, the probability of a successful defense increases, as both short-term traders and longer-term participants are more likely to step in.
Confluence strengthens the bullish case
Confluence plays a key role in technical analysis, and Dash’s current setup offers multiple layers of support. The overlap between Fibonacci retracement levels and daily horizontal support reinforces the idea that this zone represents fair value for buyers.
Historically, markets tend to respond more decisively at such levels. The fact that Dash has already shown signs of stabilization and a rebound suggests that demand is present and that sellers may be losing momentum.
Volume becomes the deciding factor
While price structure and support levels are favorable, volume remains the most important confirmation metric. Encouragingly, the recent bounce from Fibonacci support has been accompanied by a noticeable increase in volume. This suggests that buyers are engaging rather than passively absorbing the price.
For the bullish scenario to remain intact, volume must continue to expand as price moves higher. Sustained volume would indicate strong participation and improve the odds of Dash revisiting the $97 yearly high and potentially pushing beyond it.
Conversely, a lack of follow-through in volume could signal that the bounce is merely technical, increasing the risk of continued range-bound behavior.
Upside targets and resistance levels
If Dash continues to hold above the $60–62 support zone and volume remains supportive, the next major upside objective sits at the prior yearly high near $97. This level represents a key psychological and technical barrier, where profit-taking is likely to occur initially.
A clean break and acceptance above $97 would mark a significant milestone, opening the door for price discovery and higher targets. However, until that level is reclaimed, traders should expect some volatility as Dash approaches resistance.
What to expect in the coming price action
Dash is currently trading at a pivotal inflection point. As long as the price holds above the 0.618 Fibonacci level and the daily support near $59, the technical outlook favors a continuation higher.
The recent volume uptick is a positive early signal, but sustained participation will be required to confirm a renewed uptrend. If buyers maintain control, a retest of the $97 yearly high becomes increasingly likely.
Failure to hold support, however, would delay the bullish scenario and keep Dash trading within a broader consolidation range.


You May Also Like

Why Ethereum Took a Bigger Hit Than Bitcoin After Trump’s Iran “Stone Ages” Speech

Trump Crypto Manipulation: Explosive Claims of Daily Bitcoin Market Influence Through Geopolitical Statements

EUR/JPY Stalls: Critical 184.00 Level Holds as Markets Decipher ECB and BoJ Policy Signals


