

Meteora (MET/USDT) technical outlook: daily bias, key levels and trade scenarios on Meteora crypto

Price action on Meteora crypto (MET/USDT) is stuck around a tight range at $0.27, with volatility compressed and market sentiment in Extreme Fear, suggesting a larger move is likely ahead.
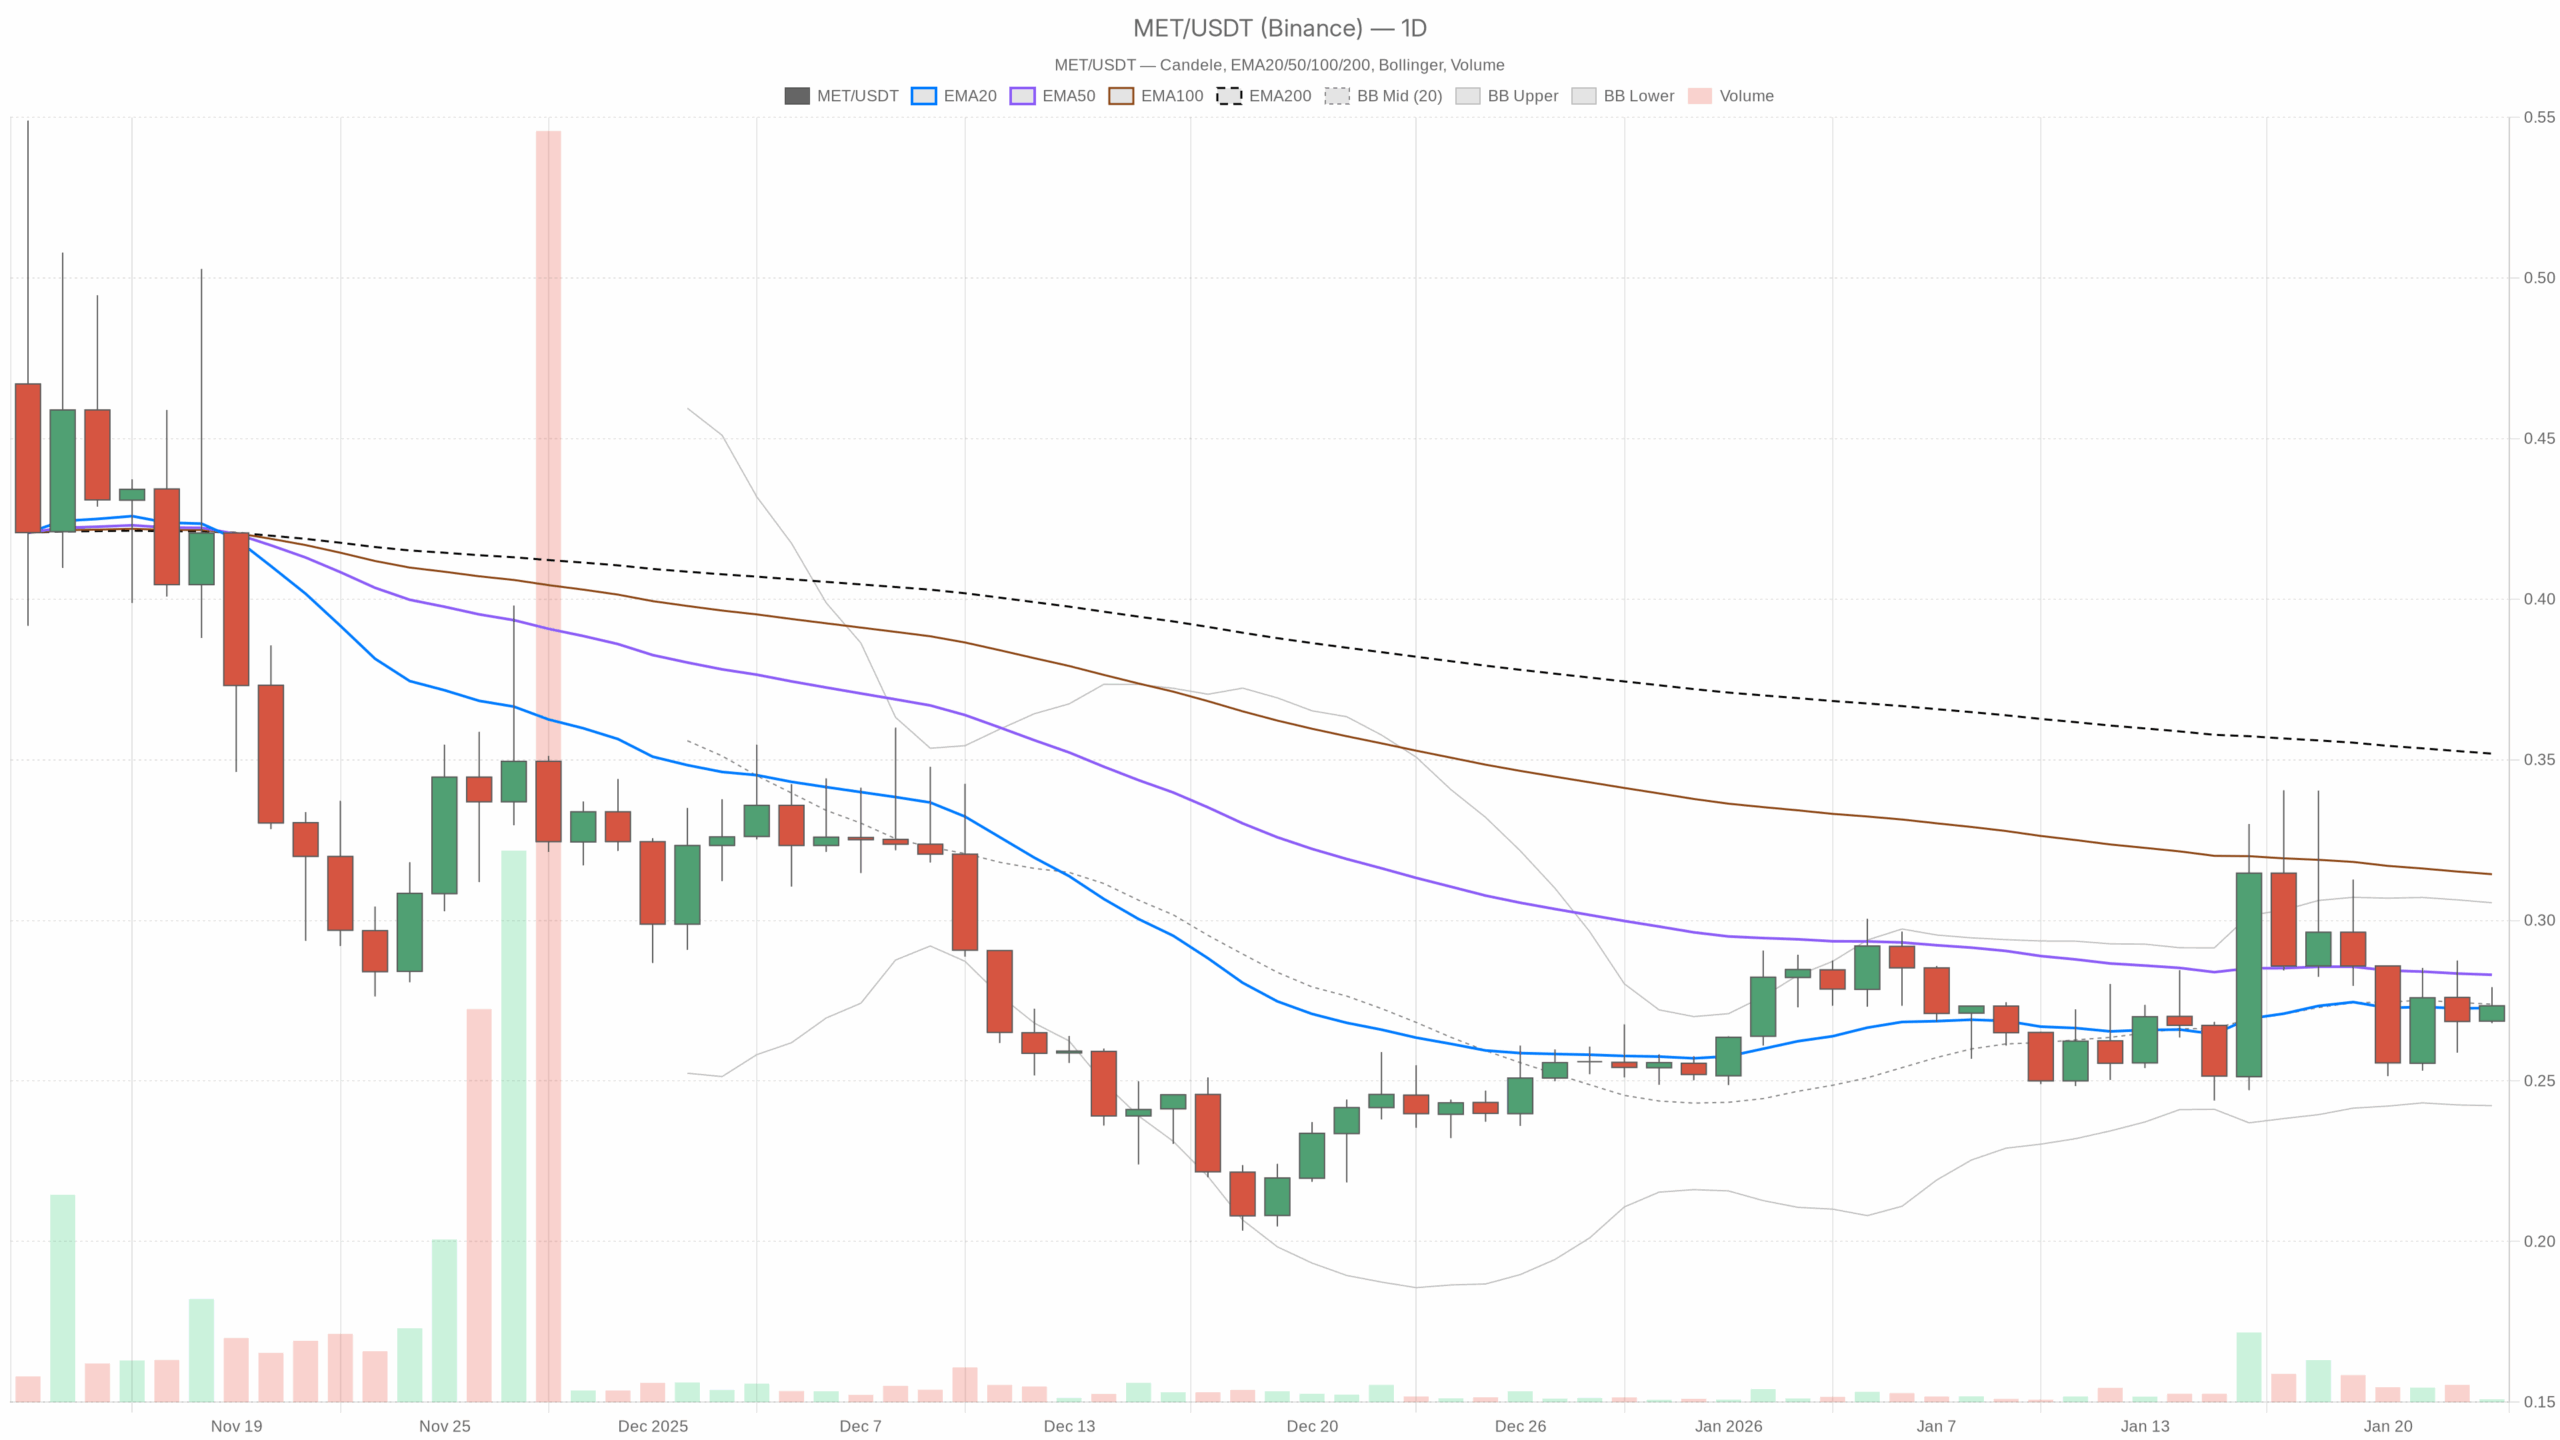 MET/USDT — daily chart with candlesticks, EMA20/EMA50 and volume.
Main scenario for METEORA crypto from the daily chart: leaning neutral-to-bearish
Based on the daily (D1) data, the primary stance is neutral-to-bearish rather than outright bullish:
- Price is well below the 200-day EMA at $0.35 – that is a classic sign of a market still trading inside a broader downtrend regime.
- EMAs on the shorter side (20 and 50) are compressing around price, showing consolidation rather than trending behavior.
- Momentum indicators (RSI, MACD) are basically flat – this is not a trending tape, it is a waiting room.
In other words, the bigger picture is still controlled by sellers. However, in the last few weeks they have stopped pressing, and the market is deciding whether $0.27 will become a base or just a temporary shelf before another leg lower.
Daily (D1) view – structure and key indicators on Meteora crypto
1. Trend and moving averages (EMA20, EMA50, EMA200)
Values (D1):
Close: $0.27
EMA20: $0.27
EMA50: $0.28
EMA200: $0.35
Price is sitting right on the 20-day EMA and just a hair under the 50-day EMA, while the 200-day EMA is still far above at $0.35.
How to read this: short term, MET is in sideways equilibrium around the 20-day average, which usually means the market is undecided. Moreover, the slightly lower 50-day versus 200-day setup, and price trading well under the 200-day, confirm that the macro trend remains down. Bulls are trying to stabilize, not trending higher yet. To flip the narrative, MET needs to reclaim and hold above the 50-day, then start closing the gap to the 200-day.
2. Daily RSI (14)
RSI14 (D1): 50.06
RSI right on 50 is about as neutral as it gets.
What this implies: there is no meaningful momentum edge to either side on the daily. Sellers have lost the upper hand they had during the prior down leg, but buyers have not taken control either. This is consistent with a consolidation after a decline – a place where markets either build a base or reload for another drop.
3. Daily MACD
MACD (D1):
Line: ~0.00
Signal: ~0.00
Histogram: 0.00
MACD is completely flat, hovering around the zero line.
What this implies: trend strength is absent on the daily timeframe. There is no clear bullish expansion or bearish acceleration. When MACD is this muted at the same time as RSI is dead center, it usually tells you the strong move already happened and the market is catching its breath. The next expansion move should be treated as important because it will likely define the next multi-week leg.
4. Bollinger Bands (D1) – volatility and range
Values (D1):
BB mid (20-period basis): $0.27
Upper band: $0.31
Lower band: $0.24
Price is glued to the middle band, with bands set roughly between $0.24 and $0.31.
What this implies: Meteora crypto is in a tight, mid-band consolidation. Price is neither pressing volatility to the upside nor testing the lower band. This is classic range behavior after a move. The band width (~$0.07) defines a first volatility envelope: breaks and daily closes near $0.31 would point to a volatility expansion higher, while daily closes near $0.24 would show volatility returning to the downside.
5. Daily ATR (14) – volatility magnitude
ATR14 (D1): 0.03
With MET/USDT at $0.27, an ATR of $0.03 means the average daily range is about 11–12% of price.
What this implies: relative to many altcoins, that level of ATR is moderate rather than explosive. The market has calmed down compared with peak volatility phases, aligning with the consolidation picture from Bollinger Bands. For traders, this means position sizing cannot assume ultra-low volatility. A normal day can still easily swing a few cents around the current price.
6. Daily pivot levels – short-term support/resistance map
Pivot Points (D1):
PP: $0.27
R1: $0.28
S1: $0.27 (effectively the same area as PP in this data set)
The main pivot (PP) is right at the current price, and the first resistance just above at $0.28. Support is effectively the same region, signaling a very tight daily range.
What this implies: the market is balanced intraday around $0.27. Any clean push above $0.28 with follow-through would be the first sign that short-term buyers are willing to pay up. Conversely, losing $0.27 on a convincing daily close would hint that the range is resolving lower. For now, these levels just frame a narrow battlefield rather than showing a directional edge.
Intraday context – H1 and M15 on MET/USDT
1-hour (H1) – micro trend and short-term momentum
Values (H1):
Close: $0.27
EMA20: $0.27
EMA50: $0.27
EMA200: $0.28
RSI14: 53.43
MACD: flat around 0.00
BB mid: $0.27 (bands roughly $0.26–0.28)
ATR14 (H1): 0.00 (effectively extremely low in the current data)
On the hourly chart, price is stacked right on top of the short EMAs, with the 200-hour EMA a little higher at $0.28. RSI sits slightly above 50, indicating a tiny bullish tilt, but MACD is again flat.
What this implies: the H1 timeframe is neutral with a slight intraday bullish lean. Buyers are doing just enough to keep MET from slipping, but not enough to break the higher timeframe structure. The very narrow Bollinger Bands and negligible ATR tell you liquidity is thin and the tape is slow. These are often conditions for a sudden, sharp move once a catalyst or larger flow hits.
15-minute (M15) – execution-level noise
Values (M15):
Close: $0.27
EMA20: $0.27
EMA50: $0.27
EMA200: $0.27
RSI14: 47.89
MACD: flat around 0.00
BB mid: $0.27 (bands essentially hugging price)
ATR14 (M15): 0.00 (range extremely compressed)
All the short EMAs are clustered at the same price and intraday volatility is almost non existent.
What this implies: on 15 minutes, MET/USDT is in pure chop mode. There is no reliable momentum and no clear micro trend. This is an environment where overtrading intraday swings typically leads to getting whipped around for nothing. M15 is useful here only to fine-tune entries around the broader scenarios, not to generate a stand-alone view.
Market environment – risk appetite and sentiment
The broader crypto market is showing:
- BTC dominance around 57.5% – capital is relatively concentrated in bitcoin, a sign of defensive positioning.
- Total market cap down about 0.4% in 24h, with volume down sharply (~-22%) – participation is muted.
- Fear & Greed Index at 24 – officially Extreme Fear.
What this implies for Meteora: altcoins like MET are not operating in a risk-on environment. When BTC dominance is high and sentiment is fearful, liquidity prefers majors and stablecoins. That tends to cap upside on smaller names unless there is a strong, asset-specific catalyst. At the same time, extreme fear often coincides with value-building phases. Markets become asymmetric, where bad news can still push price lower, but good news can trigger outsized short-covering rallies.
Scenarios for Meteora crypto (MET/USDT)
Bullish scenario
For bulls, the bet is that $0.27 is forming a base within a broader downtrend, and that a relief rally is coming once fear eases.
What bulls want to see:
- A daily close above $0.28, clearing the R1 pivot and pushing price above both the 20 and 50-day EMAs with some distance.
- RSI on D1 nudging up from 50 towards the 55–60 zone, signaling that buyers are finally gaining directional control.
- MACD turning slightly positive on D1, with the histogram ticking above zero – confirmation that the consolidation is breaking into a new upswing.
- Price stretching towards the upper Bollinger Band near $0.31. A daily close near or above that band would indicate volatility expanding to the upside.
If that sequence plays out, the first logical targets sit around $0.31 (upper band and prior range resistance). Beyond that, the bigger psychological and technical area is the 200-day EMA at $0.35. Reaching anywhere close to that level would represent a meaningful relief rally inside the still-intact larger downtrend.
What would invalidate the bullish case: a decisive daily close below $0.27 with RSI rolling down under 45 and price drifting towards the lower band at $0.24. That would show that the current base failed and that MET is shifting from sideways digestion back into a directional down move.
Bearish scenario
For bears, the view is simpler: Meteora is trapped below a falling long-term trend, sentiment is fearful, and the current equilibrium is just a pause before another leg down.
What bears want to see:
- MET slipping below $0.27 and starting to close daily candles towards $0.25–0.24, re-engaging the lower Bollinger Band.
- RSI on D1 sliding under 45, confirming that selling pressure has returned.
- MACD turning negative with the histogram printing red bars under zero, showing renewed bearish momentum after the flat phase.
- On H1, price failing at or just below the $0.28 / EMA200 (H1) area repeatedly – acting as a ceiling rather than being reclaimed.
In that case, the first near-term downside zone is the $0.24–0.25 region, in line with the lower daily band. If those levels give way with strong volume, there is room for an extension lower, especially if broader market fear intensifies or BTC takes another hit.
What would invalidate the bearish case: a clean, sustained break above $0.31 on the daily. That would mean price has pushed beyond the upper band and away from the cluster of short EMAs, with momentum no longer favoring the downside. Bears would need to reassess if MET starts spending time above that band and gravitates towards the 200-day EMA.
Neutral / range-bound scenario
The most honest reading right now is that MET/USDT is already in a range, and it may simply keep oscillating while the broader market decides its next move.
A continued neutral scenario would look like:
- Price holding roughly between $0.24 and $0.31 without decisive breaks on either side.
- RSI hovering around the 45–55 band, MACD staying flat near zero.
- EMAs (20 and 50) continuing to compress sideways around current levels.
In that environment, MET would behave more like a mean reversion instrument: fades near the edges of the range, nothing sustained. This is where intraday traders scalp and positional traders wait.
Positioning, risk, and how to think about Meteora here
Meteora crypto is sitting in a classic indecision pocket: under its long-term trend, in a compressed volatility regime, inside a fearful broader market. The signals across timeframes are not strongly aligned. D1 is neutral-to-bearish, H1 has a slight bullish lean, and M15 is pure noise. When timeframes disagree like this, conviction should be kept low and risk controlled.
For directional traders, the key is to anchor on daily levels:
- $0.27 is the pivot battleground.
- $0.24 to the downside and $0.31 to the upside mark the edges of the current volatility envelope.
- The 200-day EMA at $0.35 is the line that separates a simple bounce from a more serious trend repair.
Volatility is currently compressed, but ATR and the band width tell you moves can still be meaningful once they start. In a market dominated by extreme fear, false breaks and sharp squeezes are common. Therefore, guarding against over leverage and respecting invalidation levels is more important than trying to predict the exact next tick.
To sum up, this analysis is meant as a structural and technical roadmap for MET/USDT, not as a signal to buy or sell. The key edge here is patience: let price show whether this $0.27 shelf becomes a springboard or a trap door, then align with the emerging direction rather than trying to guess it in advance.
Open your Investing.com account
This section contains a sponsored affiliate link. We may earn a commission at no additional cost to you.
Disclaimer: The content above is for informational and educational purposes only. It is not investment, trading, or financial advice, and it should not be used as the basis for any investment decision. Cryptoassets are highly volatile and carry a significant risk of loss. Always conduct your own research and consider your risk tolerance before engaging in any trading activity.


You May Also Like

Why Ethereum Took a Bigger Hit Than Bitcoin After Trump’s Iran “Stone Ages” Speech

Trump Crypto Manipulation: Explosive Claims of Daily Bitcoin Market Influence Through Geopolitical Statements

EUR/JPY Stalls: Critical 184.00 Level Holds as Markets Decipher ECB and BoJ Policy Signals


