

Riding the Downtrend: Is Bearish Pressure Mounting on Arbitrum (ARB)?
- Arbitrum is currently trading at $0.17.
- ARB’s daily trading volume is down by 34%.
The bearish market move has brought in red waves across the crypto market, with the digital assets losing momentum. That includes the largest assets, Bitcoin (BTC) and Ethereum (ETH), trading on the downside. Among the altcoins, the Arbitrum (ARB) has registered a 0.95% drop in value.
The asset opened the day trading at a bottom of $0.175, and later, with a brief bullish shift in the ARB market, the price spiked to $0.181. But the upward swing did not last; it slipped back to the recent lows. Arbitrum currently trades at $0.1777, and the daily trading volume is down by 34.26% to $85.57 million.
Notably, the TD Sequential buy signal suggests that Arbitrum may be nearing the end of its recent downtrend, hinting at a potential short-term rebound. If $0.17 holds as support, it strengthens the case for buyers stepping in. As a result, a move toward the $0.20 level remains possible.
Zooming in on the recent bearish trading chart, the Arbitrum price could retrace toward the support at the $0.1757 level. If the bears gained more traction, the death cross might unfold and send the price to test the $0.1737 range. Upon the emergence of the bullish sentiment, the price might immediately climb to the resistance at around $0.1797. An extended upside pressure could trigger the formation of the golden cross, and the bulls would drive the price to its former high above $0.1817.
Technical Analysis Points to Weakening Arbitrum Trend
Analysing the technical chart of Arbitrum, both the Moving Average Convergence Divergence (MACD) line and the signal line have crossed below the zero line, which reflects a negative outlook. The market sentiment is weak. Besides, the Chaikin Money Flow (CMF) indicator is positioned at 0.01, implying that money flow is almost neutral. The buying and the selling pressure are nearly balanced, and the market is likely consolidating.
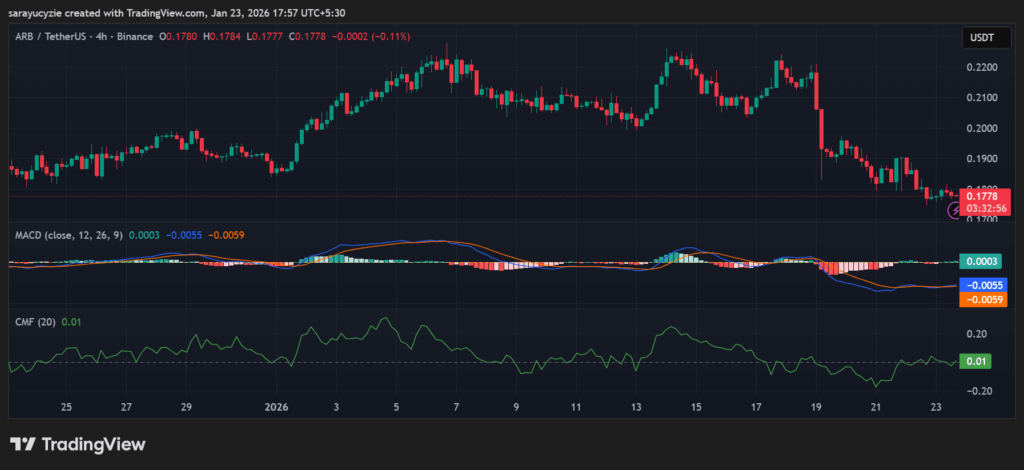 ARB chart (Source: TradingView)
Arbitrum’s current market sentiment is weak, as the daily Relative Strength Index (RSI) stays at 34.50. It may approach the oversold territory as the sellers have been stronger than the buyers recently. Furthermore, the Bull Bear Power (BBP) value of 0.0064 signals slightly more bearish dominance in the market, and the imbalance is very mild. It is a neutral-to-bearish market, but the momentum is weakly negative, not a strong downtrend.
Top Updated Crypto News
Bears Take Control of Solana (SOL): Is $125 the Bulls’ Last Line of Defence?


You May Also Like

New Zealand Retail Sales Rise 0.9% in Q1, Topping Market Expectations

BoJ’s Koeda: Monetary Policy Is the Right Tool to Tackle Inflation

They’re called ‘super pollutants’ — and Trump’s EPA wants to expose you to more of them


