

LINEA (LINEA) Price Prediction 2026–2030: Can LINEA Hit $0.01 Soon?
- LINEA confirms a powerful bullish breakout above long-term resistance, signaling trend continuation into 2026.
- RSI nearing overbought levels suggests short-term consolidation may occur before the next leg higher.
- Long-term outlook remains bullish, with $0.01 emerging as a realistic upside target if support holds.
LINEA (LINEA) has entered 2026 with strong bullish momentum after posting a decisive daily breakout on the 1D timeframe. The asset surged sharply, closing near $0.00636 after registering a daily gain of over 18%. The breakout candle pushed price firmly above key resistance levels, confirming a shift from consolidation into expansion.
LINEA is now trading well above the 20-day Simple Moving Average (SMA), while volatility has expanded significantly as reflected by the widening Bollinger Bands. Although short-term conditions appear stretched, the broader structure suggests LINEA may be entering a sustained bullish phase if buyers defend newly established support zones.
The rally has renewed interest in high-momentum altcoins, positioning LINEA as one of the technically stronger assets at the start of 2026. However, how the market responds during upcoming pullbacks will be critical in determining whether this breakout evolves into a long-term uptrend.
Also Read: River (RIVER) Price Prediction 2026–2030: Can RIVER Hit $50.00 Soon?
Market Sentiment and Momentum
Market sentiment around LINEA has turned decisively bullish as buyers dominate daily price action. The size of the breakout candle and follow-through buying indicate genuine accumulation rather than a brief speculative spike. Expanding volatility supports the view that LINEA is transitioning from a base-building phase into a momentum-driven advance.
Despite the optimism, sharp rallies are often followed by short-term profit-taking. Traders are closely watching whether LINEA can maintain higher lows during pullbacks, which would confirm trend strength and improve the probability of continued upside.
Current Market Overview
At the time of analysis, LINEA is trading around $0.00636, posting a strong daily close near session highs. The asset has decisively reclaimed and moved above the 20-day SMA, confirming a clear shift in short-term trend direction from neutral to bullish.
The breakout has also pushed price toward the upper Bollinger Band, highlighting aggressive upside momentum. While this confirms buyer dominance, sustained trading near or above the upper band often leads to consolidation before the next directional move. A period of sideways price action above the breakout zone would help reinforce the bullish structure.
Technical Analysis
From a technical perspective, LINEA remains firmly bullish, though early signs of short-term exhaustion are beginning to appear. Price is advancing significantly faster than its underlying averages, reflecting a momentum-heavy environment. The market’s behavior during any cooling-off phase will be critical in determining trend durability.
Bollinger Bands
The Bollinger Bands on the daily chart have expanded sharply, confirming a volatility-driven breakout. Price is currently trading near the upper band, while the mid-band (20-day SMA) remains far below current levels, illustrating the speed of the recent advance.
This setup signals strong bullish conviction but also suggests price is stretched in the short term. A consolidation or shallow pullback toward the mid-band region around $0.00508–$0.00536 would represent a healthy technical reset and could provide a stronger base for continuation.
RSI Behavior
The Relative Strength Index (RSI) is currently at 49.58, approaching 50, signaling a strong upward momentum but without yet entering the overbought territory. This reflects strong buying pressure and positive momentum, though it also raises the likelihood of a short-term pause or sideways movement.
In strong trends, RSI can remain elevated for extended periods. A controlled pullback that keeps RSI above the 45–50 zone would signal sustained bullish momentum. A sharper drop below 45 would suggest weakening demand and increase downside risk.
Support and Resistance Levels
Immediate support for LINEA is located in the $0.00508–$0.00536 range, which aligns with the recent breakout zone and prior consolidation highs. Holding above this level would preserve the bullish market structure. Additional support sits near $0.00500, corresponding with the rising 20-day SMA.
On the upside, immediate resistance is found near $0.00663, a key psychological level. A sustained break above this zone could open the door to higher targets at $0.00700 and $0.00800, with $0.01 emerging as a major long-term objective if momentum continues.
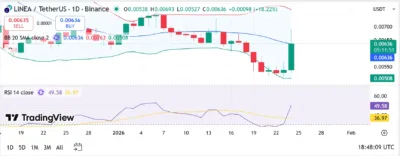
Source: Tradingview
LINEA Price Predictions (2026–2030)
| Year | Minimum Price | Average Price | Maximum Price |
|---|---|---|---|
| 2026 | $0.00500 | $0.00650 | $0.00800 |
| 2027 | $0.00650 | $0.00850 | $0.01000 |
| 2028 | $0.00800 | $0.01000 | $0.01200 |
| 2029 | $0.01000 | $0.01250 | $0.01500 |
| 2030 | $0.01200 | $0.01500 | $0.01800 |
2026
In 2026, LINEA is expected to experience heightened volatility following its breakout. If the price maintains support above the $0.00508 zone, the asset could stabilize at significantly higher valuation levels compared to late 2025. Consolidation phases followed by renewed momentum could push LINEA toward the $0.00800 range.
2027
By 2027, improving liquidity and broader market participation could support a more structured uptrend. If overall crypto sentiment remains favorable, LINEA may benefit from stronger holder confidence, allowing price to approach the $0.01000 region with reduced downside volatility.
2028
In 2028, LINEA could benefit from cyclical speculative waves within the altcoin market. Wider trading ranges are likely, but the broader trend may remain bullish. Under favorable conditions, a move toward $0.01200 would represent a major long-term milestone.
2029
As LINEA matures in 2029, it could establish stronger price stability above $0.01000, with pullbacks increasingly viewed as accumulation opportunities. Sustained interest and liquidity growth could support advances toward the $0.01500 region during bullish phases.
2030
By 2030, LINEA’s long-term performance will depend on broader adoption and macro market cycles. With favorable conditions, the asset could enter a new growth phase and potentially trade above $0.01800, supported by deeper liquidity and long-term holders.
Conclusion
LINEA enters 2026 in a technically strong position following a decisive daily breakout above key resistance levels. While near-overbought conditions suggest the possibility of short-term consolidation, the broader trend remains bullish as long as the price holds above its breakout support zone. If LINEA can continue building on its current momentum and successfully navigate consolidation phases, a move toward $0.01 becomes increasingly realistic over the next few years.
FAQs
1.What is the current market sentiment for LINEA in 2026?
Market sentiment is strongly bullish, supported by a clean breakout and aggressive buying pressure.
2. Is LINEA currently overbought?
RSI is approaching 50, suggesting strong momentum but also the potential for short-term consolidation.
3. Can LINEA hit $0.01 soon?
If LINEA maintains support above $0.00508 and bullish momentum continues, $0.01 becomes a realistic medium-term target.
4. What are the key levels to watch?
Key support lies at $0.00508 and $0.00500, while resistance is located near $0.00663 and $0.00700.
5. What is the long-term outlook for LINEA?
With favorable market conditions, LINEA could continue appreciating through 2030, potentially trading above $0.01500.
Also Read: XRP Price Prediction for January 18: Triangle Compression Puts Bulls and Bears on Edge
The post LINEA (LINEA) Price Prediction 2026–2030: Can LINEA Hit $0.01 Soon? appeared first on 36Crypto.


You May Also Like

NordFX Morning Update — June 12, 2026

Bitget Unveils AI Agent Accounts to Enable Autonomous Crypto Trading
SEC Proposes Elimination of Trading Rules That Block Tokenized Securities on DeFi Platforms


