Bitcoin price stabilizes as three-drive pattern hints at short-term bounce
Bitcoin price is stabilizing near channel support, and a developing three-drive pattern hints at a potential relief bounce if a market structure break confirms the setup.
- Bitcoin remains within a large channel, trading near channel low support.
- A developing three-drive pattern suggests seller exhaustion and rising demand.
- A market structure break is required to confirm a short-term relief bounce.
Bitcoin’s (BTC) recent price action suggests the market may be approaching an inflection point after an extended corrective phase. While the broader structure remains bearish, BTC is currently trading within a well-defined higher-time-frame channel, bounded by clear resistance at the channel high and support at the channel low.
Within this framework, emerging lower-time-frame developments are beginning to resemble a three-drive pattern, a formation that can precede short-term reversals when confirmed. Although the pattern has not yet been activated, the current behavior near channel support warrants close attention.
Bitcoin price key technical points
- Large channel structure intact: Bitcoin continues to respect channel boundaries.
- Potential three-drive pattern forming: Repeated reactions near channel support suggest building demand.
- Market structure break required: Confirmation depends on invalidating lower highs.
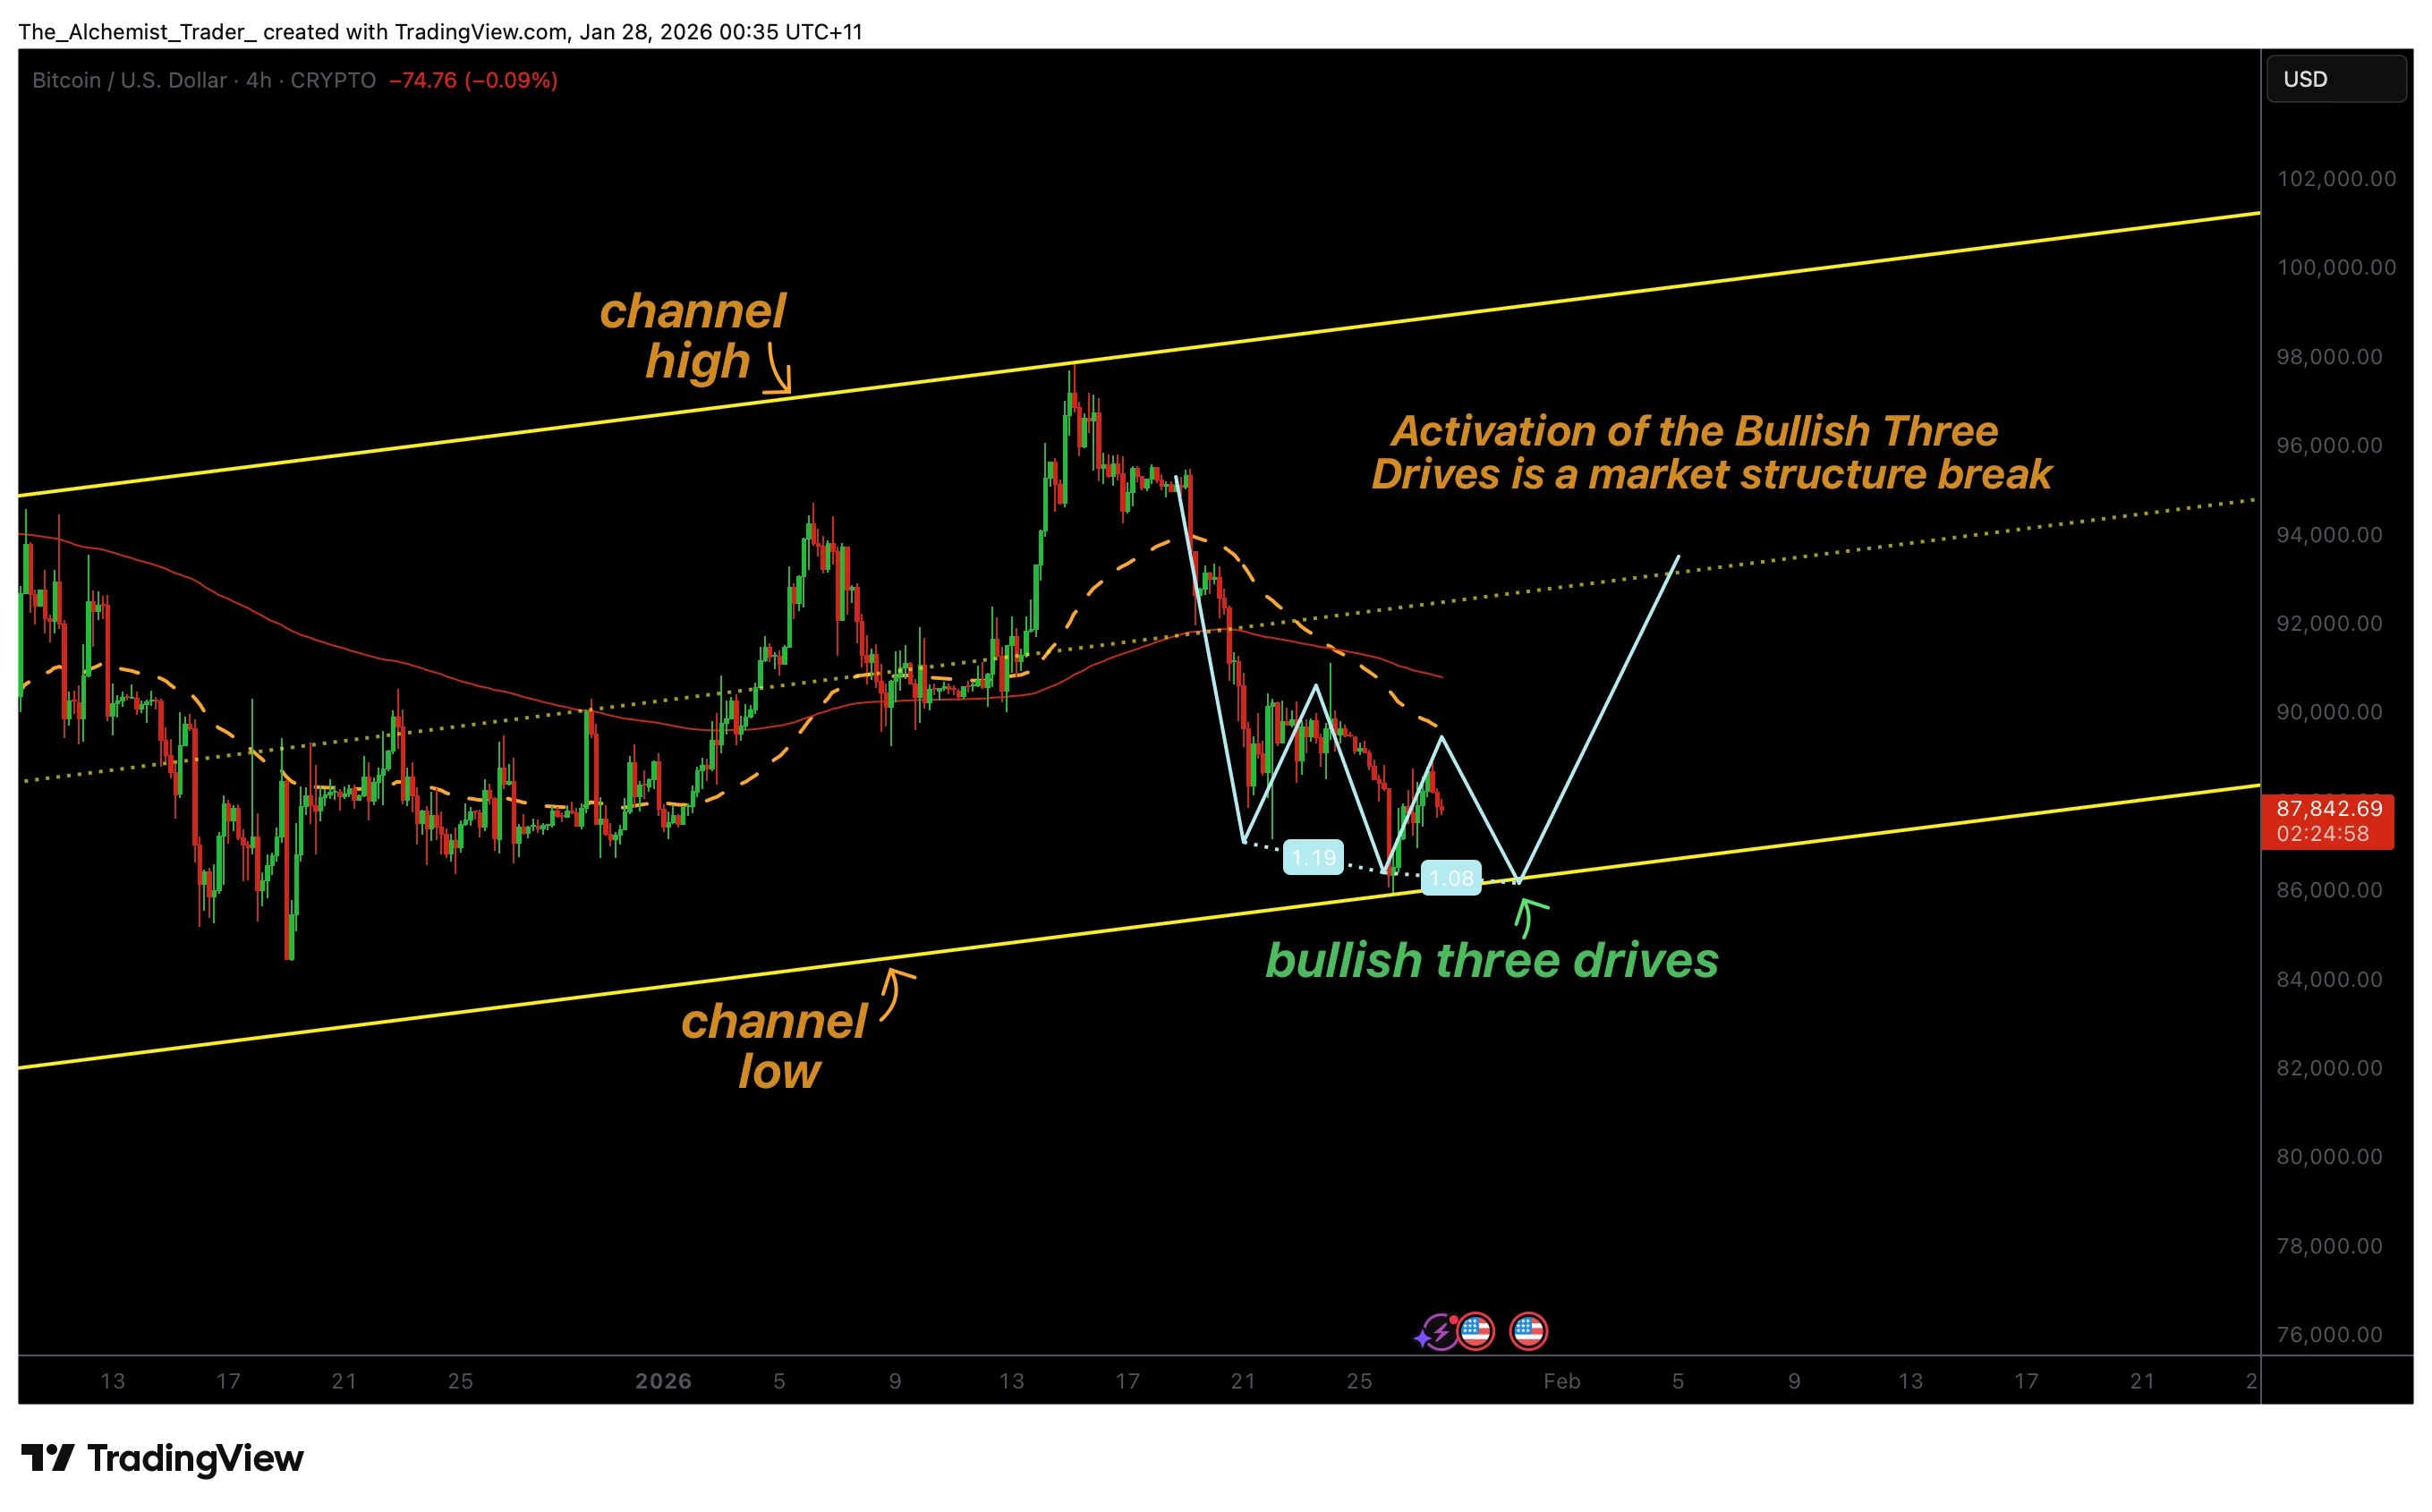
Bitcoin is currently in a corrective phase, but importantly, this correction is occurring within a larger, orderly channel rather than a disorderly sell-off. Channels often provide context for mean reversion, as prices oscillate between upper resistance and lower support. At present, BTC is trading near the channel low, an area that historically attracts buying interest, especially when momentum begins to slow.
The presence of a channel helps frame expectations: while the trend remains under pressure, downside may be limited near support unless sellers regain strong momentum.
Three-drive pattern begins to take shape
On the local time frame, price action is starting to resemble a three-drive pattern, characterized by three successive pushes toward a support zone, each losing momentum. In Bitcoin’s case, price has produced three distinct rallies and pullbacks into the channel low, with each subsequent drive failing to extend meaningfully lower.
This behavior often signals seller exhaustion and the gradual emergence of demand. While not a guarantee of reversal, the pattern suggests that buyers are increasingly willing to defend the same support region, reducing downside follow-through.
Why confirmation matters
Despite the improving local structure, it’s important to stress that the three-drive pattern has not yet been activated. Confirmation requires a market structure break, typically defined by price reclaiming a prior lower high and establishing acceptance above it. Until this occurs, the broader bearish structure, marked by consecutive lower highs, remains intact.
In other words, the pattern is currently potential, not confirmed. Traders should treat the setup as a developing opportunity rather than a signal to front-run a reversal.
Market structure remains bearish, for now
From a higher-time-frame perspective, Bitcoin continues to trade below key resistance levels, and rallies have so far been sold into. This keeps the prevailing bias cautious. For the three-drive pattern to translate into a meaningful relief bounce, Bitcoin must change the projection of its structure, breaking the sequence of lower highs.
A successful structure break would signal that demand has overcome supply in the short term, increasing the probability of a rotation higher within the channel.
Upside implications if confirmed
If Bitcoin confirms the three-drive pattern with a market structure break, the most likely outcome would be a relief bounce rather than an immediate trend reversal. Such bounces often target mid-channel levels or prior resistance zones, allowing price to rebalance after prolonged selling.
This would be consistent with corrective behavior inside a channel, where price oscillates between extremes rather than trending decisively in one direction.
What to expect in the coming price action
Bitcoin is approaching a technically sensitive area near channel low support, where a potential three-drive pattern is developing. As long as price holds this support, the probability of a short-term relief bounce remains on the table. However, confirmation is critical: a market structure break is required to activate the pattern and invalidate the sequence of lower highs.
Until then, the broader bias remains cautious, and traders should watch closely for acceptance above resistance to confirm that a relief bounce is underway.


You May Also Like

AI Helps Recover 5 BTC After 11 Years, CoinDCX CEO Issues Warning

Ethereum (ETH) Falls Behind Bitcoin (BTC) as JPMorgan Casts Doubt on Network Revival