Bitcoin is struggling to bounce back from its January $98k peak, while gold climbs past $5k. What's going on?Bitcoin is struggling to bounce back from its January $98k peak, while gold climbs past $5k. What's going on?

Gold vs Bitcoin price prediction: Why gold is outperforming BTC right now?

In early 2026, gold and Bitcoin are moving in opposite directions. Bitcoin is struggling to bounce back from its January $98,000 peak, while gold climbs past $5,000, led by tokenized markets.

Table of Contents

  • Tokenized gold breaks out above $5,000
  • Gold price prediction: Why the rally looks durable
  • Why Bitcoin is going down
  • Bitcoin price prediction: Key downside levels
  • BTC-to-Gold ratio signals defensive capital shift
  • Final outlook

The takeaway: investors are playing it safe rather than chasing risky gains.

Summary
  • Gold is climbing while Bitcoin faces downside pressure, with potential drops to $74,000, $68,000, or even $53,000 in extreme scenarios.
  • The BTC-to-Gold ratio near 17.3 signals a defensive capital shift, favoring gold over Bitcoin until market risk appetite improves.
  • Tokenized gold, like Pax Gold and Tether Gold, trades 24/7, accelerating price discovery and reflecting real-time macro demand.

Tokenized gold breaks out above $5,000

Pax Gold and Tether Gold broke above $5,000 this week, rising from the mid-$4,600s and holding support near $4,900 as gold rallied.

Because tokenized gold trades 24/7, macro demand showed up instantly, accelerating price discovery and highlighting tokenization’s edge over traditional markets.

Gold price prediction: Why the rally looks durable

This gold rally isn’t driven by speculation — it’s fundamentals at work. Central banks are buying more gold than they have in decades, and worries about geopolitics, debt, and currencies keep demand strong.

Gold vs Bitcoin price prediction: Why gold is outperforming BTC right now? - 2

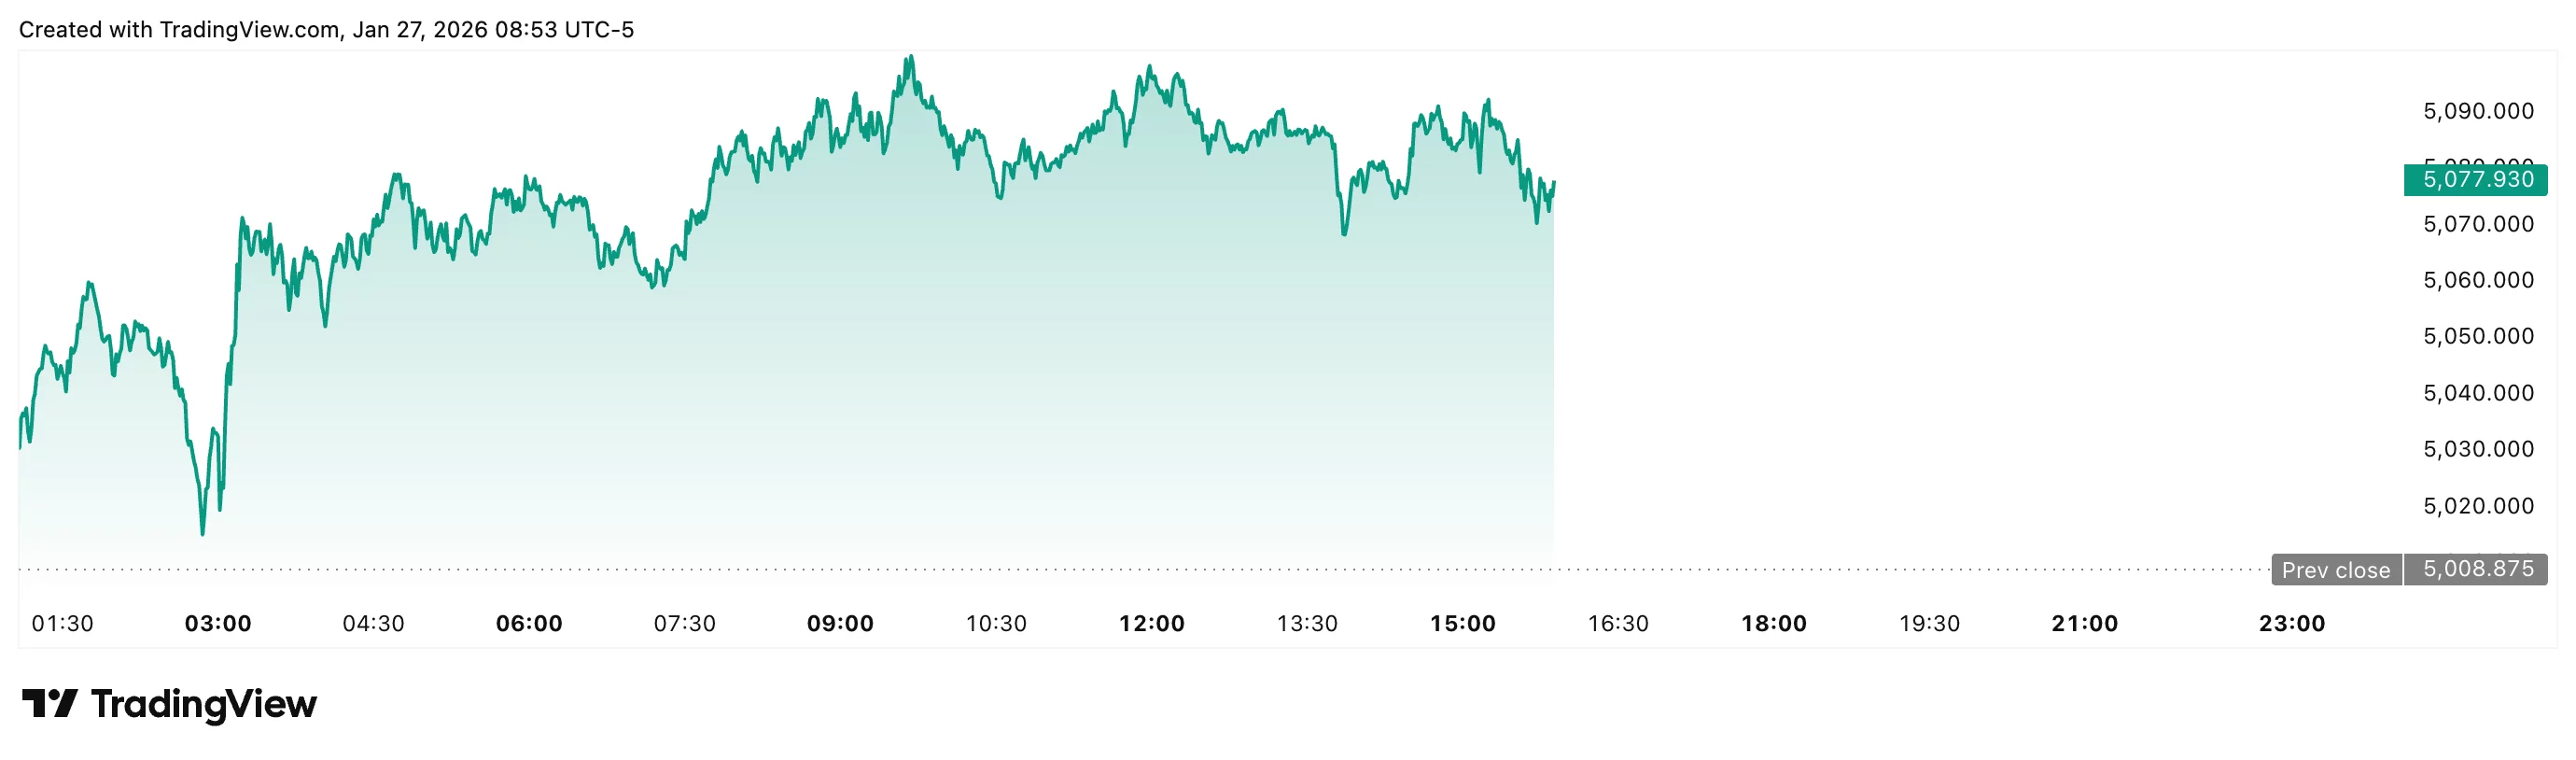
With gold near $5,080, banks are raising long-term forecasts, and tokenized gold reflects these expectations in real time, giving a sneak peek at how markets could trade 24/7.

Why Bitcoin is going down

Bitcoin (BTC) has come under pressure as investors shift toward safer assets.

Weakening global risk sentiment, U.S. policy uncertainty, and fears of a yen carry-trade unwind are weighing on prices.

Gold vs Bitcoin price prediction: Why gold is outperforming BTC right now? - 3

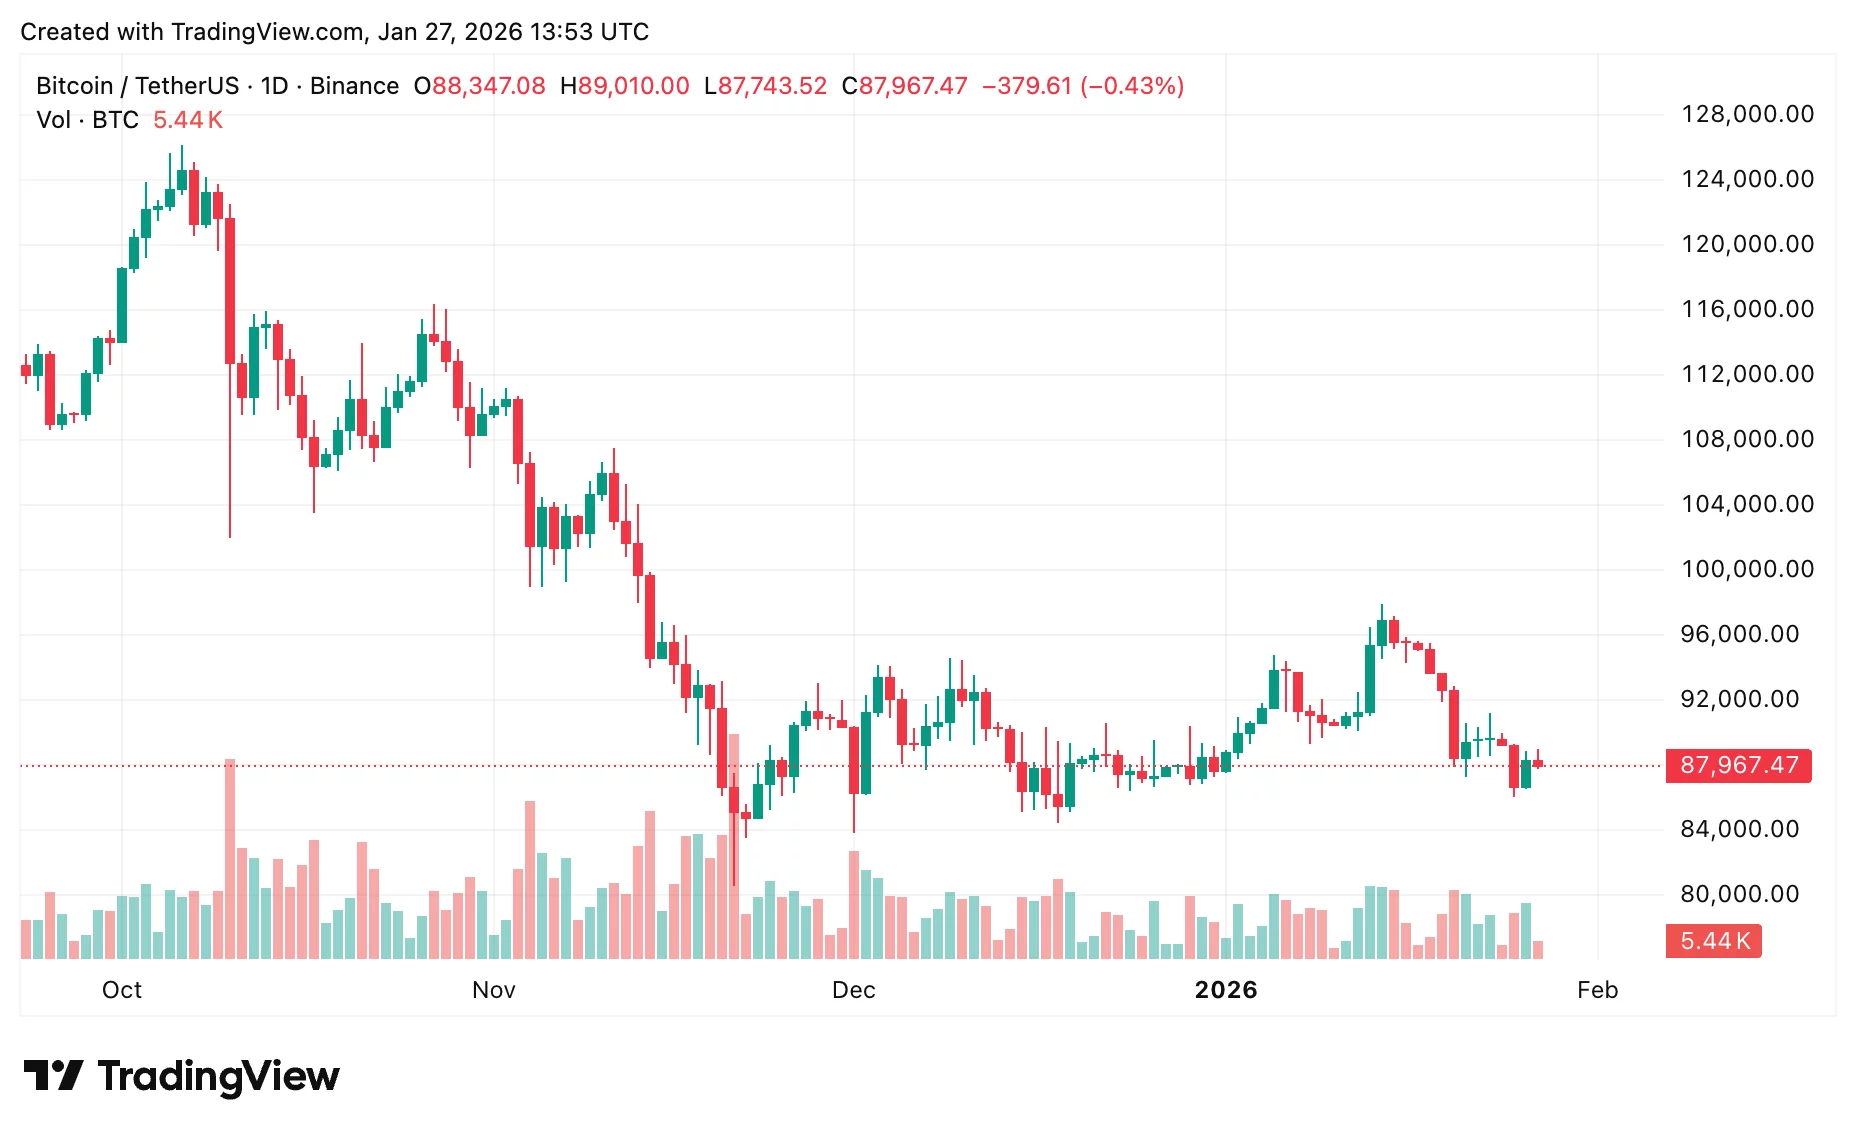
Trading around $87,967, Bitcoin has fallen more than 10% from its January peak.

Bitcoin price prediction: Key downside levels

On the technical side, Bitcoin looks at risk of testing the $82,000–$85,000 support area.

If macro conditions continue to deteriorate and the Fed stays hawkish, the next downside levels sit around $74,000 and $68,000. 

In a more extreme sell-off, Fibonacci extensions point to a possible move toward $53,000 — near the psychologically important $50,000 mark.

It’s not the main scenario, but it’s a risk if markets stay in risk-off mode.

BTC-to-Gold ratio signals defensive capital shift

The BTC-to-Gold ratio is around 17.3, close to the lower end of its usual range.

It shows how much gold one Bitcoin can buy and gives a sense of whether investors are taking risks or playing it safe.

In past Bitcoin bull runs, this ratio often went above 30–35. Right now, tight liquidity and muted speculation leave gold as the clear winner.

Final outlook

Gold’s outlook remains positive thanks to strong institutional buying, while Bitcoin forecasts point to continued volatility and potential downside. Gold is likely to keep its edge over Bitcoin until investors grow more confident.

Disclaimer: The articles reposted on this site are sourced from public platforms and are provided for informational purposes only. They do not necessarily reflect the views of MEXC. All rights remain with the original authors. If you believe any content infringes on third-party rights, please contact [email protected] for removal. MEXC makes no guarantees regarding the accuracy, completeness, or timeliness of the content and is not responsible for any actions taken based on the information provided. The content does not constitute financial, legal, or other professional advice, nor should it be considered a recommendation or endorsement by MEXC.

You May Also Like

Franklin Templeton CEO Dismisses 50bps Rate Cut Ahead FOMC

Franklin Templeton CEO Dismisses 50bps Rate Cut Ahead FOMC

The post Franklin Templeton CEO Dismisses 50bps Rate Cut Ahead FOMC appeared on BitcoinEthereumNews.com. Franklin Templeton CEO Jenny Johnson has weighed in on whether the Federal Reserve should make a 25 basis points (bps) Fed rate cut or 50 bps cut. This comes ahead of the Fed decision today at today’s FOMC meeting, with the market pricing in a 25 bps cut. Bitcoin and the broader crypto market are currently trading flat ahead of the rate cut decision. Franklin Templeton CEO Weighs In On Potential FOMC Decision In a CNBC interview, Jenny Johnson said that she expects the Fed to make a 25 bps cut today instead of a 50 bps cut. She acknowledged the jobs data, which suggested that the labor market is weakening. However, she noted that this data is backward-looking, indicating that it doesn’t show the current state of the economy. She alluded to the wage growth, which she remarked is an indication of a robust labor market. She added that retail sales are up and that consumers are still spending, despite inflation being sticky at 3%, which makes a case for why the FOMC should opt against a 50-basis-point Fed rate cut. In line with this, the Franklin Templeton CEO said that she would go with a 25 bps rate cut if she were Jerome Powell. She remarked that the Fed still has the October and December FOMC meetings to make further cuts if the incoming data warrants it. Johnson also asserted that the data show a robust economy. However, she noted that there can’t be an argument for no Fed rate cut since Powell already signaled at Jackson Hole that they were likely to lower interest rates at this meeting due to concerns over a weakening labor market. Notably, her comment comes as experts argue for both sides on why the Fed should make a 25 bps cut or…
Share
BitcoinEthereumNews2025/09/18 00:36
Egrag Crypto: XRP Could be Around $6 or $7 by Mid-November Based on this Analysis

Egrag Crypto: XRP Could be Around $6 or $7 by Mid-November Based on this Analysis

Egrag Crypto forecasts XRP reaching $6 to $7 by November. Fractal pattern analysis suggests a significant XRP price surge soon. XRP poised for potential growth based on historical price patterns. The cryptocurrency community is abuzz after renowned analyst Egrag Crypto shared an analysis suggesting that XRP could reach $6 to $7 by mid-November. This prediction is based on the study of a fractal pattern observed in XRP’s past price movements, which the analyst believes is likely to repeat itself in the coming months. According to Egrag Crypto, the analysis hinges on fractal patterns, which are used in technical analysis to identify recurring market behavior. Using the past price charts of XRP, the expert has found a certain fractal that looks similar to the existing market structure. The trend indicates that XRP will soon experience a great increase in price, and the asset will probably reach the $6 or $7 range in mid-November. The chart shared by Egrag Crypto points to a rising trend line with several Fibonacci levels pointing to key support and resistance zones. This technical structure, along with the fractal pattern, is the foundation of the price forecast. As XRP continues to follow the predicted trajectory, the analyst sees a strong possibility of it reaching new highs, especially if the fractal behaves as expected. Also Read: Why XRP Price Remains Stagnant Despite Fed Rate Cut #XRP – A Potential Similar Set-Up! I've been analyzing the yellow fractal from a previous setup and trying to fit it into various formations. Based on the fractal formation analysis, it suggests that by mid-November, #XRP could be around $6 to $7! Fractals can indeed be… pic.twitter.com/HmIlK77Lrr — EGRAG CRYPTO (@egragcrypto) September 18, 2025 Fractal Analysis: The Key to XRP’s Potential Surge Fractals are a popular tool for market analysis, as they can reveal trends and potential price movements by identifying patterns in historical data. Egrag Crypto’s focus on a yellow fractal pattern in XRP’s price charts is central to the current forecast. Having contrasted the market scenario at the current period and how it was at an earlier time, the analyst has indicated that XRP might revert to the same price scenario that occurred at a later cycle in the past. Egrag Crypto’s forecast of $6 to $7 is based not just on the fractal pattern but also on broader market trends and technical indicators. The Fibonacci retracements and extensions will also give more insight into the price levels that are likely to be experienced in the coming few weeks. With mid-November in sight, XRP investors and traders will be keeping a close eye on the market to see if Egrag Crypto’s analysis is true. If the price targets are reached, XRP could experience one of its most significant rallies in recent history. Also Read: Top Investor Issues Advance Warning to XRP Holders – Beware of this Risk The post Egrag Crypto: XRP Could be Around $6 or $7 by Mid-November Based on this Analysis appeared first on 36Crypto.
Share
Coinstats2025/09/18 18:36
“Very High” uncertainty forces ECB into wait-and-see mode

“Very High” uncertainty forces ECB into wait-and-see mode

The post “Very High” uncertainty forces ECB into wait-and-see mode appeared on BitcoinEthereumNews.com. The European Central Bank needs to be ready to move in any
Share
BitcoinEthereumNews2026/01/28 02:57