The post LINK Price Slips as ETFs Absorb Supply but Charts Signal More Downside appeared first on Coinpedia Fintech News The LINK price today hovered near $11.95The post LINK Price Slips as ETFs Absorb Supply but Charts Signal More Downside appeared first on Coinpedia Fintech News The LINK price today hovered near $11.95

LINK Price Slips as ETFs Absorb Supply but Charts Signal More Downside

Bitwise Chainlink ETF Approved for NYSE Arca Listing Under CLNK Ticker

The post LINK Price Slips as ETFs Absorb Supply but Charts Signal More Downside appeared first on Coinpedia Fintech News

The LINK price today hovered near $11.95 at the time of writing as its spot ETFs quietly absorbed supply. While institutional inflows remain steady and on-chain accumulation continues, the market response has been still muted, raising questions about whether Chainlink’s next move requires deeper price discounts before momentum returns.

According to on-chain and ETF tracking data, spot LINK ETFs have already accumulated more than 1% of Chainlink’s total circulating supply, with a market cap of $8.42 billion. The 1% makes the Total net assets across the products approximately $85.34 million.

Notably, this absorption has come from just two sponsors, Grayscale and Bitwise, alone, highlighting the scale of capital concentration involved.

LINK Price Slips as ETFs Absorb Supply but Charts Signal More Downside

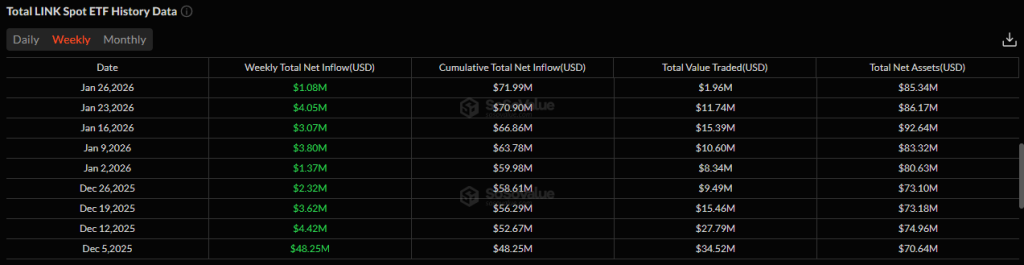
Meanwhile, ETF flow data shows no recorded weekly outflows since launch, suggesting sustained accumulation rather than speculative rotation. From a market structure perspective, this steady buying provides a longer-term demand base even as price action remains soft.

Strategic Reserves and On-Chain Accumulation Build

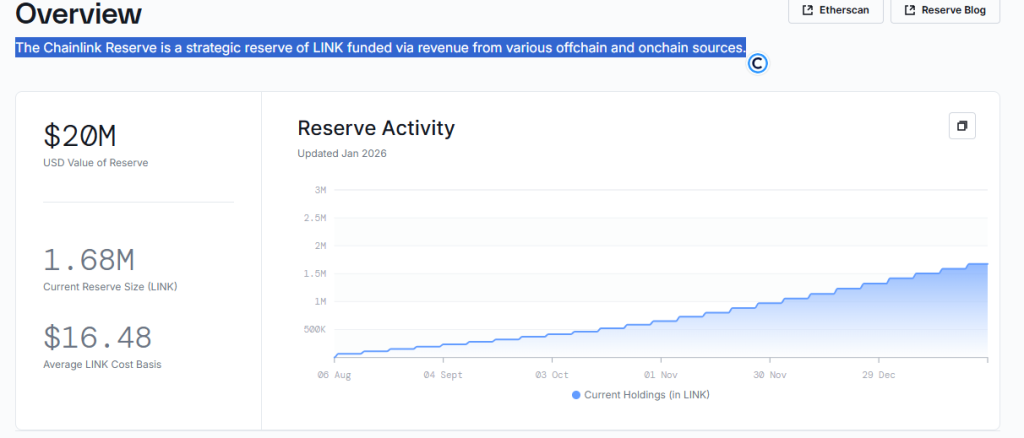
At the same time, Chainlink’s internal reserve holdings have continued to grow. The Chainlink Reserve which now holds roughly 1.68 million LINK tokens, funded through a mix of on-chain and off-chain revenue streams. This expansion reinforces the protocol’s long-term sustainability strategy.

LINK Price Slips as ETFs Absorb Supply but Charts Signal More Downside

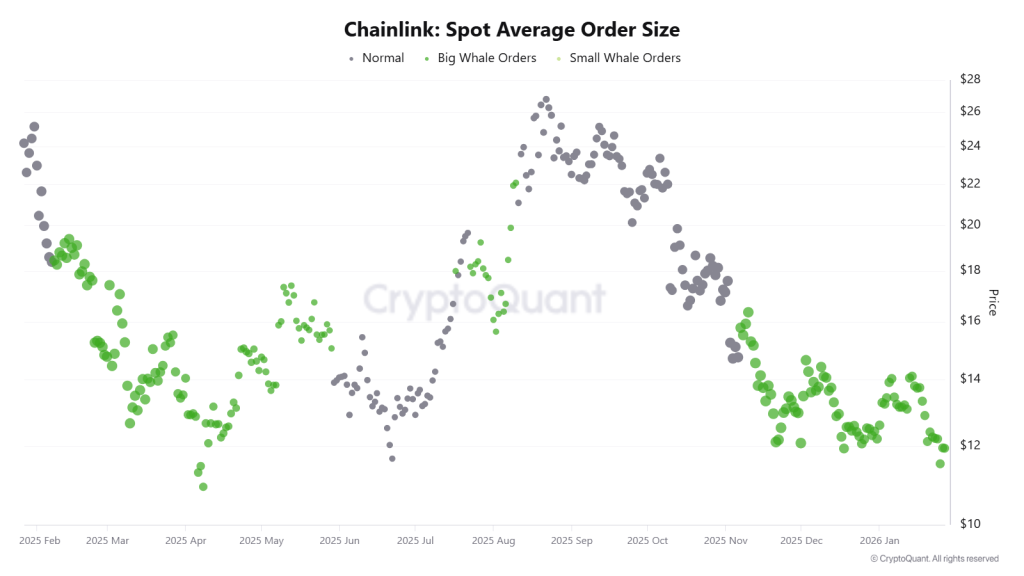
Beyond treasury data, on-chain metrics add another layer. Exchange reserves and whale activity have both trended higher, signaling accumulation rather than distribution. 

LINK Price Slips as ETFs Absorb Supply but Charts Signal More Downside

Collectively, these dynamics support a constructive long-term view for LINK crypto, even as short-term price weakness persists.

That said, institutional participation often comes with a preference for discounted entry points or simple they look for “dirt cheap prices”. Despite visible accumulation, price behavior suggests maybe institutional buyers are not yet satisfied. 

Historically, large entities tend to scale positions during drawdowns rather than during strength, and the current LINK price chart appears to reflect that pattern.

LINK Price Slips as ETFs Absorb Supply but Charts Signal More Downside

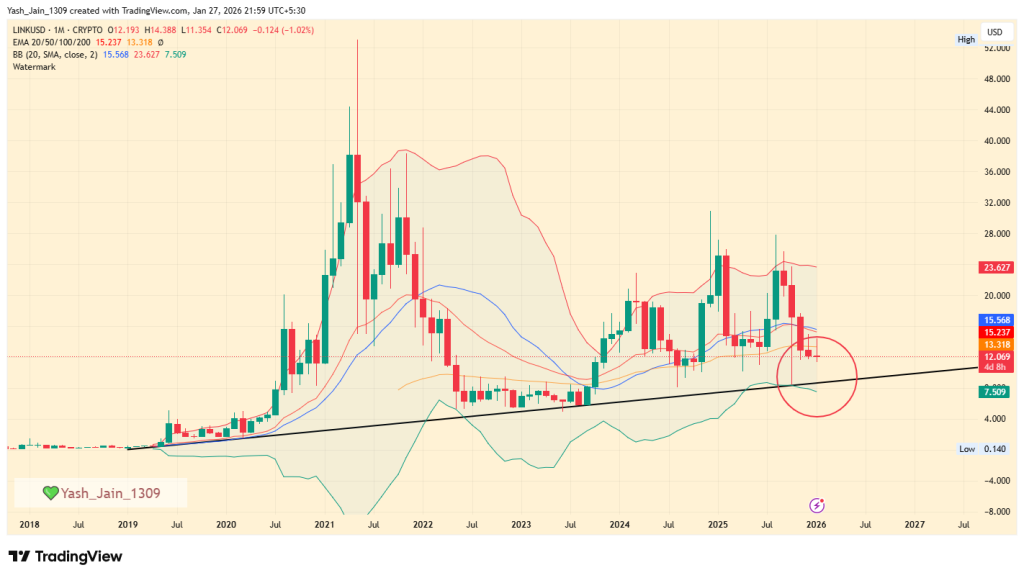
From a broader technical angle, LINK crypto’s monthly structure shows that major uptrends have typically started only after a decisive monthly closing candle on its long-term ascending trendline. That confirmation has not occurred since 2023. The current decline may therefore represent the type of drawdown institutions often seek before re-engaging more aggressively.

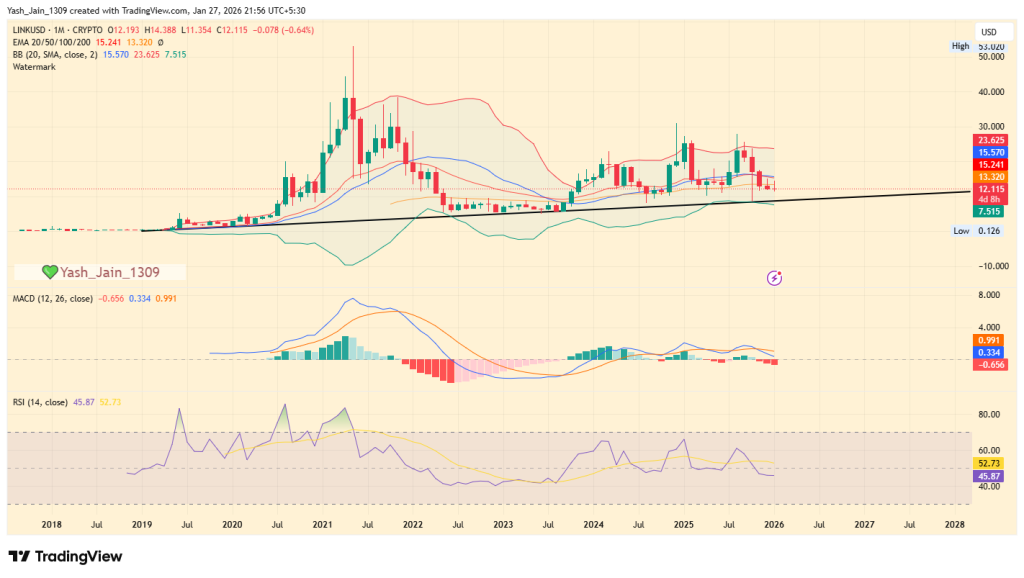
From a technical perspective, several indicators continue to lean bearish. The monthly Bollinger Bands show room toward the lower band, while the MACD has printed a bearish cross. Meanwhile, the RSI slipping below 50 suggests weakening bullish momentum.

LINK Price Slips as ETFs Absorb Supply but Charts Signal More Downside

Technically, dynamic support aligns near the $8.75–$9.00 zone, roughly 25% below current levels. If price revisits this region, it would align with historical accumulation phases seen before prior multi-month recoveries. In that context, the current setup suggests the LINK price forecast narrative remains vulnerable in the near term, even as longer-term fundamentals remain intact.

Disclaimer: The articles reposted on this site are sourced from public platforms and are provided for informational purposes only. They do not necessarily reflect the views of MEXC. All rights remain with the original authors. If you believe any content infringes on third-party rights, please contact [email protected] for removal. MEXC makes no guarantees regarding the accuracy, completeness, or timeliness of the content and is not responsible for any actions taken based on the information provided. The content does not constitute financial, legal, or other professional advice, nor should it be considered a recommendation or endorsement by MEXC.

You May Also Like

VET Technical Analysis Jan 27

VET Technical Analysis Jan 27

The post VET Technical Analysis Jan 27 appeared on BitcoinEthereumNews.com. VET is consolidating at the 0.01$ level with a %1.57 intraday drop, while the short-
Share
BitcoinEthereumNews2026/01/28 04:29
ArtGis Finance Partners with MetaXR to Expand its DeFi Offerings in the Metaverse

ArtGis Finance Partners with MetaXR to Expand its DeFi Offerings in the Metaverse

By using this collaboration, ArtGis utilizes MetaXR’s infrastructure to widen access to its assets and enable its customers to interact with the metaverse.
Share
Blockchainreporter2025/09/18 00:07
BlackRock boosts AI and US equity exposure in $185 billion models

BlackRock boosts AI and US equity exposure in $185 billion models

The post BlackRock boosts AI and US equity exposure in $185 billion models appeared on BitcoinEthereumNews.com. BlackRock is steering $185 billion worth of model portfolios deeper into US stocks and artificial intelligence. The decision came this week as the asset manager adjusted its entire model suite, increasing its equity allocation and dumping exposure to international developed markets. The firm now sits 2% overweight on stocks, after money moved between several of its biggest exchange-traded funds. This wasn’t a slow shuffle. Billions flowed across multiple ETFs on Tuesday as BlackRock executed the realignment. The iShares S&P 100 ETF (OEF) alone brought in $3.4 billion, the largest single-day haul in its history. The iShares Core S&P 500 ETF (IVV) collected $2.3 billion, while the iShares US Equity Factor Rotation Active ETF (DYNF) added nearly $2 billion. The rebalancing triggered swift inflows and outflows that realigned investor exposure on the back of performance data and macroeconomic outlooks. BlackRock raises equities on strong US earnings The model updates come as BlackRock backs the rally in American stocks, fueled by strong earnings and optimism around rate cuts. In an investment letter obtained by Bloomberg, the firm said US companies have delivered 11% earnings growth since the third quarter of 2024. Meanwhile, earnings across other developed markets barely touched 2%. That gap helped push the decision to drop international holdings in favor of American ones. Michael Gates, lead portfolio manager for BlackRock’s Target Allocation ETF model portfolio suite, said the US market is the only one showing consistency in sales growth, profit delivery, and revisions in analyst forecasts. “The US equity market continues to stand alone in terms of earnings delivery, sales growth and sustainable trends in analyst estimates and revisions,” Michael wrote. He added that non-US developed markets lagged far behind, especially when it came to sales. This week’s changes reflect that position. The move was made ahead of the Federal…
Share
BitcoinEthereumNews2025/09/18 01:44