

BNB: Neutral Daily Trend with Short-Term Bullish Pressure Building Near Support

Price is compressing a trend as BNB trades in a neutral daily structure while short-term charts lean bullish and prepare for a potential breakout or deeper pullback.
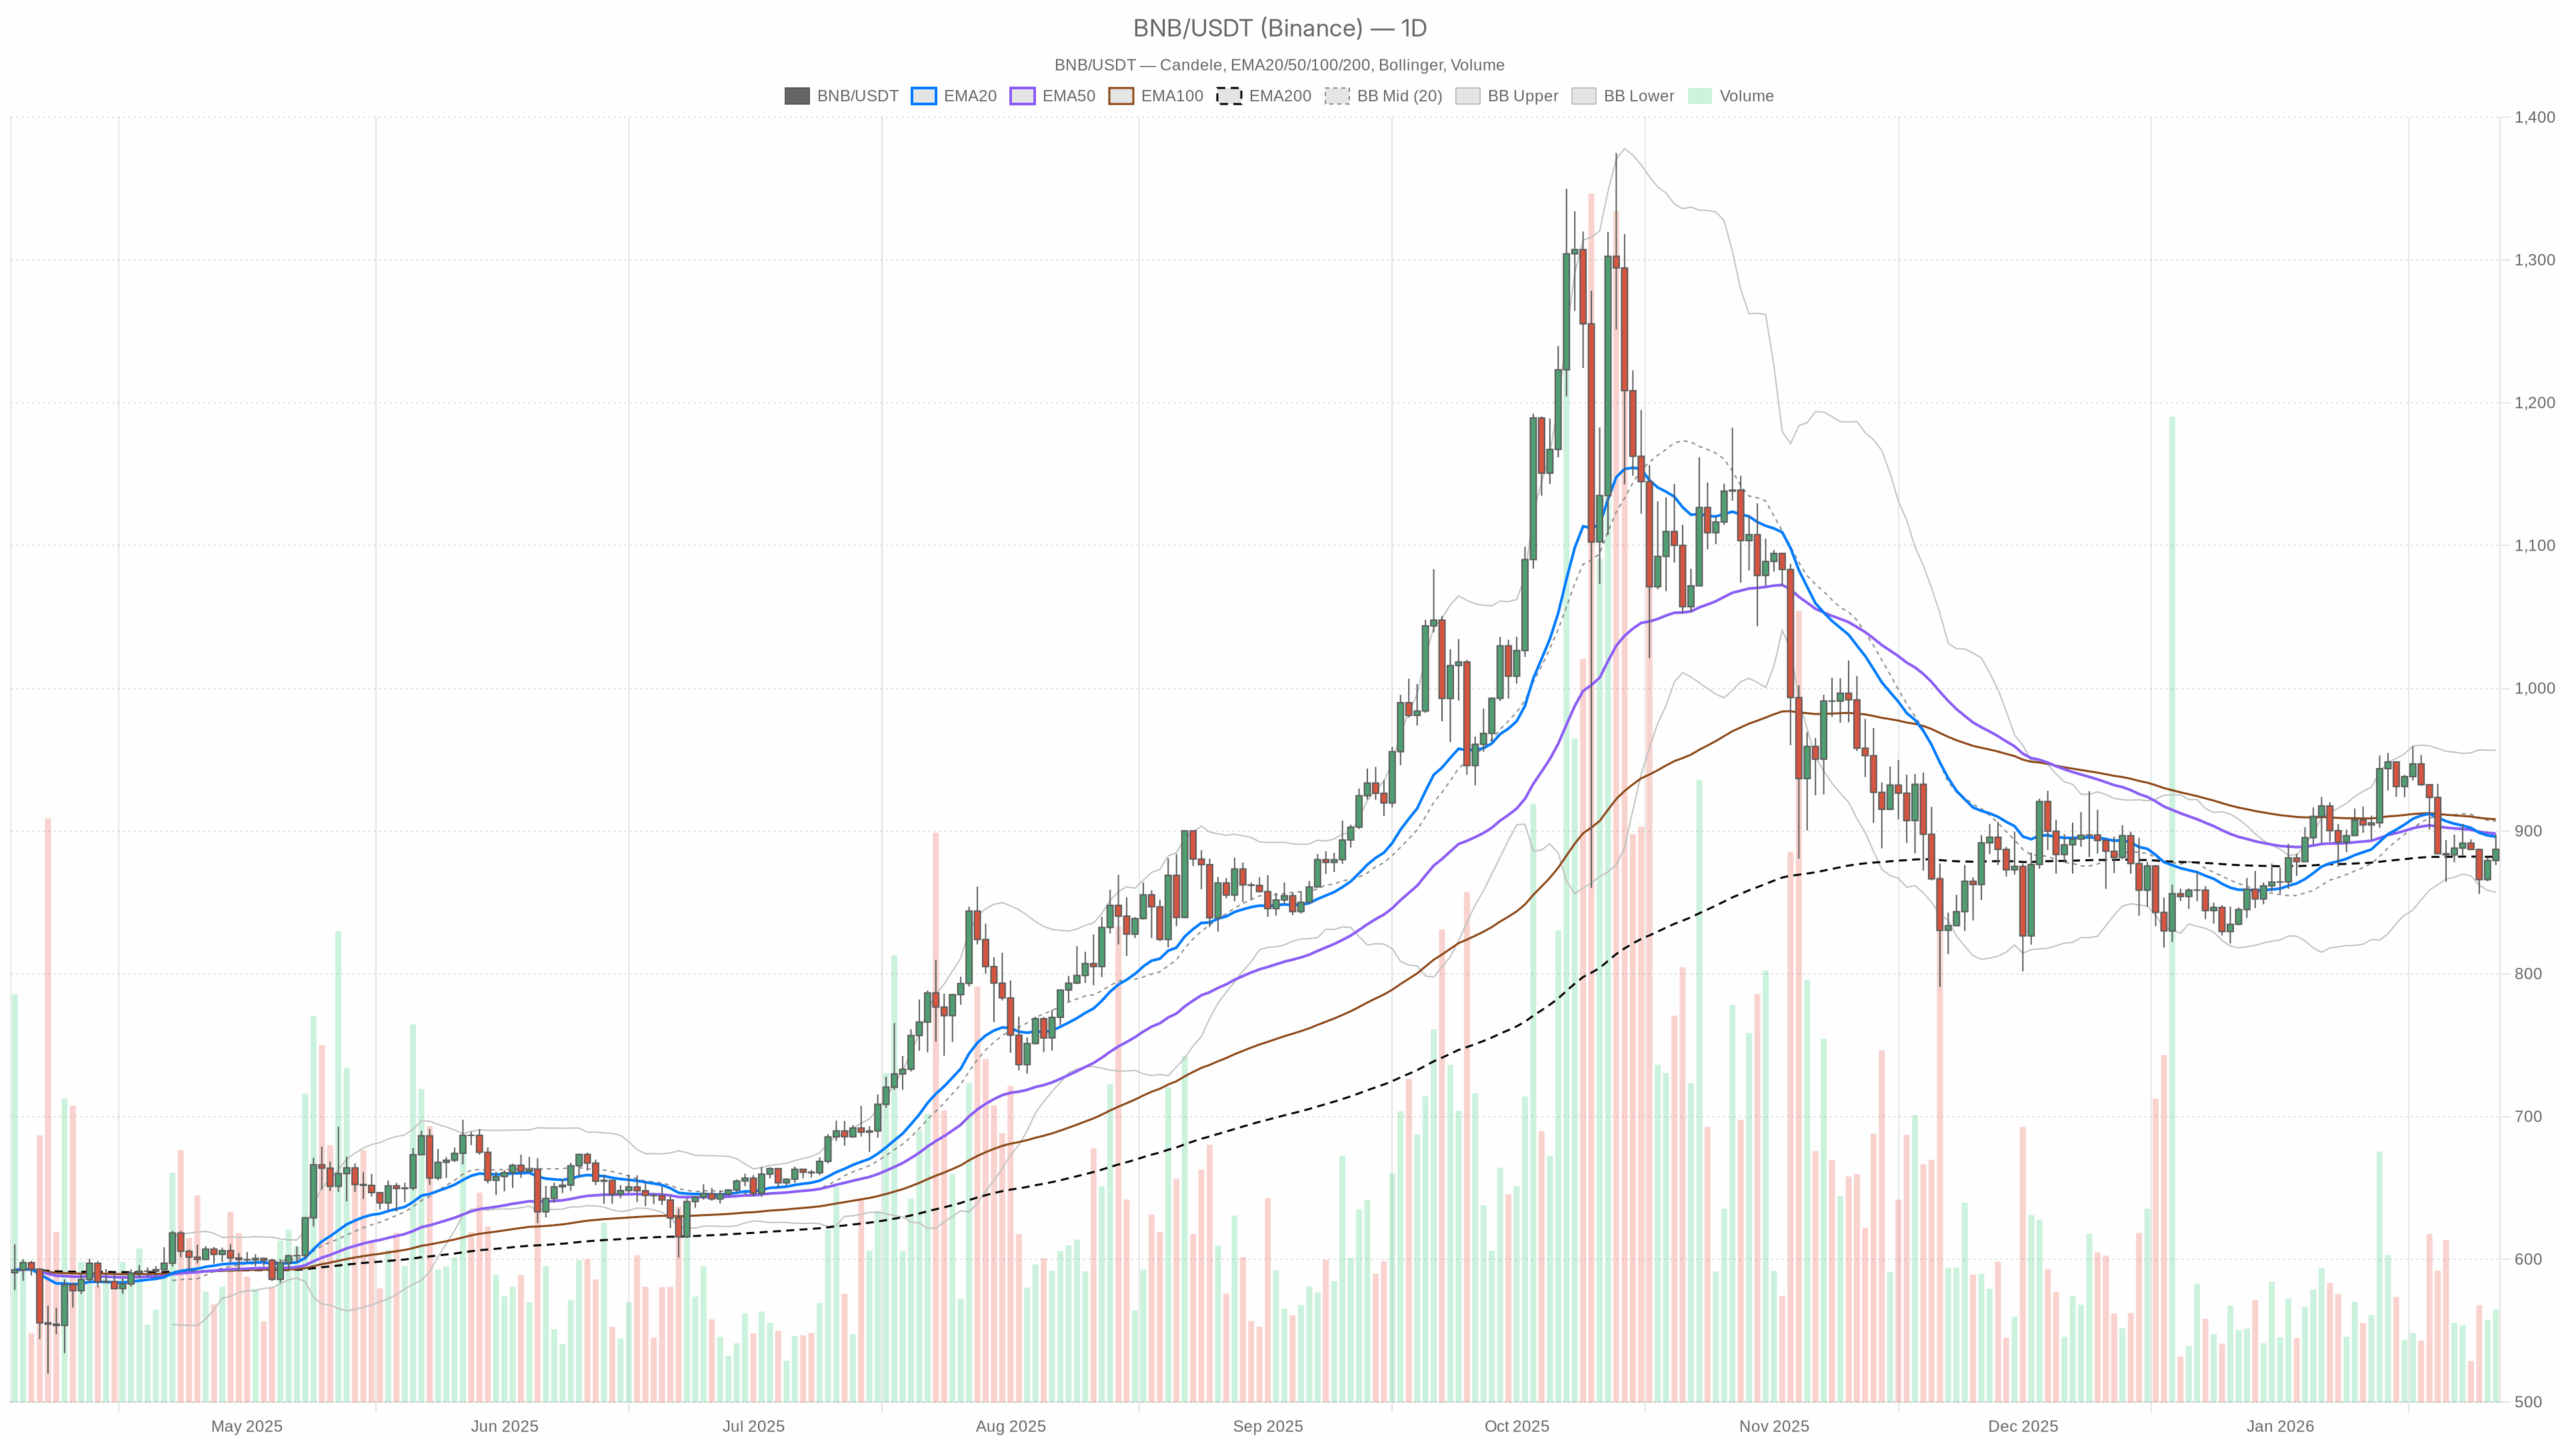 BNB/USDT — daily chart with candlesticks, EMA20/EMA50 and volume.
Daily (D1): Neutral Bias, Sitting on the Fence
On the daily timeframe, BNB is in a neutral regime. Price closed at 887.3, essentially flat with the daily pivot at 887.07. This is a balance point, not a trending structure.
EMAs (Trend Structure – D1)
• 20‑day EMA: 896.06
• 50‑day EMA: 898.32
• 200‑day EMA: 882.05
• Price (close): 887.3
The 20 and 50 EMAs are slightly above current price, while the 200‑day EMA is just below it. That puts BNB in a mild squeeze between short and medium-term averages overhead and longer-term support underneath. Short-term trend is leaning soft-bearish, but the longer-term structure is intact as long as price holds above the 200‑day. In plain terms, this is a pullback resting on long-term support, not a confirmed downtrend.
RSI (Momentum – D1)
• RSI 14‑day: 47.13
RSI is slightly below the midline but far from oversold. Momentum is neither strongly bullish nor strongly bearish, and it reflects a market catching its breath. This supports the idea that the recent weakness is more of a consolidation than a capitulation.
MACD (Trend Momentum – D1)
• MACD line: -2.48
• Signal line: 3.42
• Histogram: -5.9
MACD is negative with a clearly negative histogram, showing bears have had the upper hand recently. However, these values are modest, not the kind of wide separation you see in a strong trend. It confirms that the daily chart has lost upside momentum, but the market is not in an aggressive sell phase yet, more like a controlled drift lower into support.
Bollinger Bands (Volatility & Position – D1)
• Middle band: 906.95
• Upper band: 956.73
• Lower band: 857.18
• Price: 887.3
Price is trading below the middle band but still comfortably above the lower band. That places BNB in the lower half of its recent volatility range without signs of a volatility spike or an extreme band touch. It is a classic consolidation zone where the next move could be either a mean reversion back to the mid-band around 907 or a continuation lower toward the 857 area if support gives way.
ATR (Volatility – D1)
• ATR 14‑day: 24.35
Daily ATR around 24 points signals moderate volatility: enough to make swings meaningful, but not in panic mode. This size of movement means that breaks of key levels by 1–1.5× ATR start to matter. Anything smaller can easily be noise inside the current range.
Daily Pivot Levels (Structure – D1)
• Pivot (PP): 887.07
• Resistance 1 (R1): 897.95
• Support 1 (S1): 876.43
Price is glued to the pivot, with R1 and S1 framing a tight, roughly 22‑point daily range. That is a market in balance: buyers and sellers are testing each other right at fair value. A daily close above R1 would start to shift the bias back to bullish mean reversion, while a break and hold below S1 would confirm that the pullback is evolving into a more serious downswing.
Daily conclusion: the main scenario on D1 is neutral, tilted slightly bearish in momentum but anchored by the 200‑day EMA. The market is waiting for a catalyst.
1‑Hour (H1): Short-Term Bullish, But Under a Bigger Cap
The 1‑hour chart shows a neutral regime label but the structure is short-term bullish. Price is above the 20 and 50 EMAs, with momentum turning up, yet still under the 200 EMA which acts as a cap.
EMAs (Trend Structure – H1)
• 20‑EMA: 882.71
• 50‑EMA: 880.16
• 200‑EMA: 891.39
• Price: 887.45
On H1, price is above the 20 and 50 EMAs but still below the 200‑EMA. That is a local intraday up-leg inside a broader capped structure. Bulls have control in the very short term, but the 891–892 zone, where the 200‑EMA sits, is the first serious ceiling. Until that breaks, this is a rally inside a neutral or pullback context, not a full trend reversal.
RSI (Momentum – H1)
• RSI 14‑hour: 58.02
RSI just under 60 shows healthy, but not overheated, intraday buying pressure. Momentum is on the bulls side for now, but there is still room before intraday conditions become stretched.
MACD (Trend Momentum – H1)
• MACD line: 2.81
• Signal line: 2.23
• Histogram: 0.58
MACD is positive and the histogram is slightly above zero. That lines up with the price trading above the short EMAs: buyers are pushing upward, albeit with modest strength. This is consistent with a controlled grind higher, not an impulsive breakout yet.
Bollinger Bands (Volatility & Position – H1)
• Middle band: 883.01
• Upper band: 890.82
• Lower band: 875.19
• Price: 887.45
Price is trading between the middle and upper band, slightly in the upper half of the hourly range. That is what you want to see in a mild uptrend: buyers pressing toward the top of the volatility envelope without blowing it out. It supports the idea of short-term bullish pressure aiming into the 890–892 area.
ATR (Volatility – H1)
• ATR 14‑hour: 4.55
Hourly ATR near 4.5 points is modest but tradable. On this timeframe, small moves of 3–5 points are standard noise, and only pushes beyond that, especially past structural levels, start to look meaningful.
Hourly Pivot Levels (Structure – H1)
• Pivot (PP): 890.61
• Resistance 1 (R1): 894.56
• Support 1 (S1): 883.51
Current price at 887.45 is below the hourly pivot at 890.61, despite the short EMAs pointing up. That tells you the intraday bounce is still in recovery mode. Bulls have work to do reclaiming the pivot before they can seriously challenge higher resistance. If price can hold above 883–884 and push through 891–895, the intraday tone turns clearly bullish.
15‑Minute (M15): Bullish Execution Context
The 15‑minute chart is firmly in a bullish regime, and this is where timing comes into play for active traders.
EMAs (Micro Trend – M15)
• 20‑EMA: 886.91
• 50‑EMA: 884.03
• 200‑EMA: 879.97
• Price: 887.25
Price is above all three EMAs, with a clean bullish stack where the 20‑EMA is above the 50‑EMA and the 50‑EMA is above the 200‑EMA. That reflects a short-term uptrend where dip-buyers are likely to show up near the 20‑ and 50‑EMA on pullbacks, at least until this micro structure breaks.
RSI (Momentum – M15)
• RSI 14‑min: 52.48
RSI is almost perfectly neutral around 50 despite the bullish regime, meaning the short-term uptrend is not yet overextended. Intraday traders have room on both sides: the market can continue grinding higher or briefly mean-revert without flashing extreme conditions.
MACD (Trend Momentum – M15)
• MACD line: 2.73
• Signal line: 1.98
• Histogram: 0.74
MACD is positive with a healthy, but not explosive, histogram. Short-term buyers have the initiative, and momentum aligns with the EMA stack. For execution, this typically favors buying dips rather than chasing spikes, as the trend is up but not vertical.
Bollinger Bands (Volatility & Position – M15)
• Middle band: 885.45
• Upper band: 895.66
• Lower band: 875.24
• Price: 887.25
Price is just above the middle band, in the upper half of the 15‑minute range but nowhere near the upper band. This points to a controlled grind higher, not a blow-off move. Small dips toward the mid-band have been getting bought so far.
ATR (Volatility – M15)
• ATR 14‑min: 3.73
ATR around 3.7 on M15 indicates that a typical 15‑minute bar covers a fair chunk of the days ATR. This underlines that intraday swings can be sharp relative to the daily move, so position sizing and stops need to account for that noise.
15‑Minute Pivot Levels (Execution Zones – M15)
• Pivot (PP): 888.8
• Resistance 1 (R1): 890.92
• Support 1 (S1): 885.12
Price is trading slightly below the 15‑minute pivot, but the regime remains bullish. That combination often means a constructive pullback inside an intraday uptrend. S1 near 885 and the rising 50‑EMA form an immediate support pocket. R1 at 890.92 aligns closely with the hourly resistance band and 200‑EMA, turning the 890–892 zone into a key intraday decision level.
Market Context & Sentiment
Broad crypto market cap is modestly up, around 0.16% on the day, with a notable drop in 24h volume of about -24.4%. BTC dominance above 57% shows flows are concentrated in majors, not high-beta altcoins. Meanwhile, the Fear & Greed index at 29 (Fear) indicates investors are still defensive, not euphoric.
For BNBUSDT, this backdrop usually means limited speculative excess. Moves tend to be cleaner but less explosive unless a strong catalyst appears. DeFi fee trends show mixed activity, with PancakeSwap AMM fees sharply higher over 30 days, hinting that some on-chain activity is returning, but not yet in a sustained risk-on wave.
Scenarios
Primary Bias: Neutral on Daily, Bullish Intraday
The higher timeframe on D1 calls for a neutral main scenario, with price trapped between short-term bearish momentum and long-term support. Intraday, however, both the 1‑hour and 15‑minute charts show constructive bullish structure pushing price back toward resistance.
Bullish Scenario
In the bullish path, the intraday up-move continues, and BNBUSDT reclaims and holds above the cluster of resistance around 890–895:
• 15m R1 at 890.92 gets cleared and holds as support.
• H1 pivot at 890.61 and H1 R1 at 894.56 are broken and retested from above.
• Price regains the H1 200‑EMA near 891.39 and starts closing hourly candles above it.
If this plays out, the next logical magnet is the daily Bollinger mid-band around 907, with room toward the upper band near 957 if volatility expands. On the way, the daily 20 and 50 EMAs between 896–898 turn from overhead resistance into support. RSI on D1 would need to push back above 50 and the MACD histogram to shrink toward zero, showing that downside momentum has faded.
This bullish scenario is invalidated if BNBUSDT fails repeatedly at the 890–895 zone and breaks back below 876–880 with strong volume, especially if daily closes start forming under the 200‑day EMA around 882. That would confirm the intraday strength was just a dead-cat bounce.
Bearish Scenario
In the bearish outcome, the intraday bounce runs out of steam under the 200‑EMA on H1, and sellers press price through local support:
• M15 support at 885.12 and the 50‑EMA give way.
• H1 S1 at 883.51 fails, leading to a test of the daily S1 at 876.43.
• Daily closes start printing below the 200‑day EMA around 882.
Under this pressure, daily MACD would likely extend deeper into negative territory, and RSI could slide decisively below 45, indicating momentum is moving from neutral to outright bearish. Technically, that opens a path toward the lower Bollinger Band around 857, and potentially lower if broader market risk-off accelerates.
This bearish scenario is invalidated if price quickly reclaims and holds above the 890–895 resistance zone, flips the 200‑EMA on H1 into support, and daily RSI recovers back above 50. In that case, the selling pressure would be better read as a completed pullback rather than the start of a larger downtrend.
How to Think About Positioning Now
BNBUSDT currently sits in a tactical tug-of-war. The daily chart is sideways and indecisive, while intraday structure favors the bulls but right into a dense cluster of resistance around 890–895. That makes this region a genuine decision zone rather than a place to form strong directional convictions without confirmation.
For short-term traders, the key is respecting the multi-timeframe tension. The 15‑minute and 1‑hour charts suggest buying dips as long as price stays above roughly 883–885, but the daily chart insists that until the market clears the 896–900 area, this is still just a rally inside a broader consolidation. For swing traders, the higher-probability entries usually come after the market shows whether the 200‑day EMA at 882 holds or fails decisively.
Volatility is moderate on all timeframes, which means breakouts can be tradable but are less forgiving if they turn into fakeouts. With market sentiment in Fear and BTC dominance high, the environment still rewards risk control and flexibility over aggressive, one-sided bets.
Open your Investing.com account
This section contains a sponsored affiliate link. We may earn a commission at no additional cost to you.
All market views expressed here are informational and educational in nature. They reflect a technical interpretation of current data and are not a recommendation to buy, sell, or hold any asset. Markets are volatile and unpredictable; always consider your own risk tolerance and time horizon.


You May Also Like

Why Is Crypto Down Today: Pepeto Crosses $8.6 Million as XRP Price Prediction Tests $1.30 and ETH Fights for $2,000

Coinbase Receives OCC Approval for National Trust Charter

