

Bitcoin Erases $85B in 4 Hours as Crypto Faces $500M Liquidations
The leading cryptocurrency, Bitcoin BTC $83 897 24h volatility: 6.3% Market cap: $1.68 T Vol. 24h: $64.87 B , has just erased more than $85 billion of its market capitalization in less than four hours, facing more than $200 million in liquidations in the same period, post US market opening.
By the time of this writing, BTC was trading at $84,437, down 5.83% in the last 24 hours, according to CoinMarketCap on Jan. 29. With that, Bitcoin saw its nearly $1.70 trillion capitalization losing approximately $85 billion in a sudden crash that affected the entire crypto market.
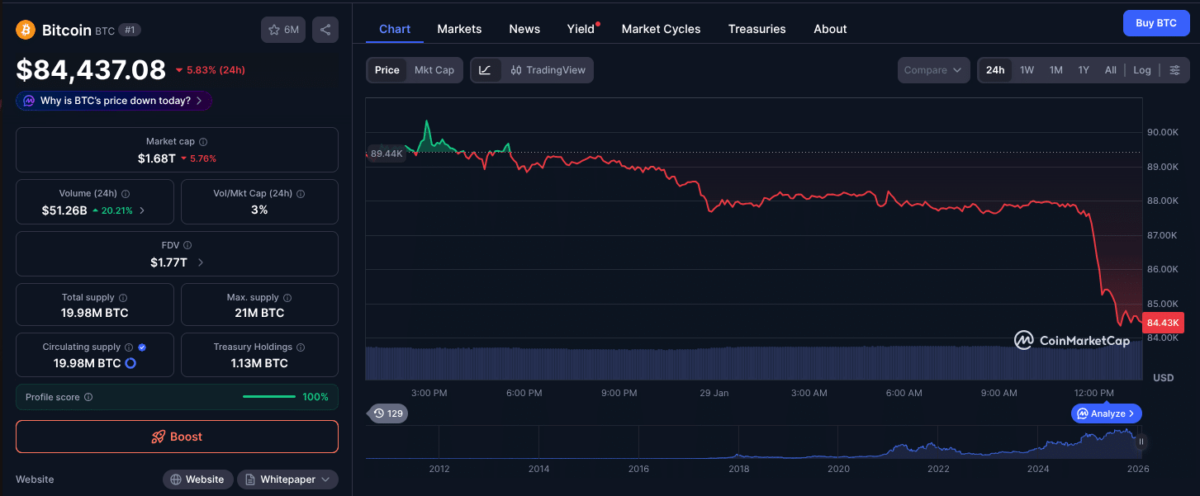
Bitcoin (BTC) market data and price as of January 29, 2026 | Source: CoinMarketCap
Bitcoin’s 24-hour exchange volume raised by 20% to $51 billion, representing 3% of its market cap. The crash started just a few minutes after the United States stock market opened in the red on Jan. 29. Both the S&P 500, the US dollar index, gold, silver, and other leading assets are trading at losses intraday.
Nevertheless, a drop to this price region was already expected by prominent analysts like CrypNuevo. The analyst has been warning of this possibility for over a month, arguing that BTC would need to revisit a price range between $80,000 and $84,000 before it was ready to seek new highs above $100,000.
Crypto Traders Face $500M Liquidations in 4 Hours
Notably, this aggressive price drop caused a new cascade of liquidations, most from long positions, in a short time frame (four hours), according to CoinGlass data.
Overall, $500 million were erased from leveraged trading positions in the past four hours of this writing—$471 million of which were from longs.
Bitcoin alone saw $206 million in four-hour liquidations, $202 million of that coming from long positions.
In a higher time frame, more than 200,000 crypto traders saw more than $800 million in liquidations in the last 24 hours. The single largest liquidation happened in the BTC-USD pair on Hyperliquid, at a nominal value of $31 million. It was a long position.
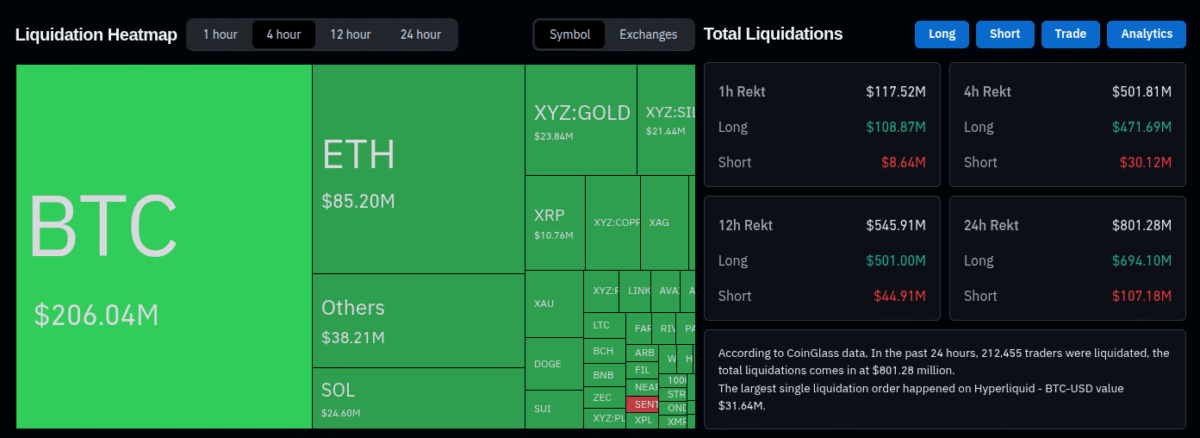
Liquidation heatmap and total liquidations (4-hour), as of January 29, 2026 | Source: CoinGlass
Interestingly, these numbers, while terrifying, are nowhere close to the $19.35 billion liquidations crypto faced on Oct. 10.
Bitcoin and other cryptocurrencies could now be ready to rebound after erasing these liquidation clusters to the downside—accumulated since late 2025. However, this could only happen if macroeconomics and geopolitical affairs contribute to risk-on liquidity, which is highly uncertain at this point.
On that note, JPMorgan explained that BTC is not acting as a hedge to the falling US dollar, unlike precious metals like gold, silver, and copper that saw expressive rallies this week.
nextThe post Bitcoin Erases $85B in 4 Hours as Crypto Faces $500M Liquidations appeared first on Coinspeaker.


You May Also Like

Spot XRP ETFs Top $60M in Weekly Flows, Best Week Since December

Russian Stablecoin A7A5 Claims It Can Thrive Even If Sanctions Are Lifted


