Buffer ETFs vs. market-linked GICs: Which is better?
The first month of a new year tends to bring a familiar checklist for Canadian investors. There is fresh tax-free savings account (TFSA) contribution room to use. For 2026, that number is $7,000. There is also the annual rush to finish topping up registered retirement savings plan (RRSP) contributions within the first 60 days for the prior tax year.
Bank advisors know this rhythm well. If you have cash sitting idle, there is a good chance you have received a call inviting you to review your financial plan or come into a branch. The objective is usually the same: get that cash invested into one of the bank’s in-house products.
For older clients, or those flagged through the know-your-client process as having a lower risk tolerance, the conversation often shifts toward market-linked guaranteed investment certificates (GICs). These products are typically presented as a way to participate in stock market gains while keeping your principal protected.
That pitch has worked for decades. But in 2026, market-linked GICs are no longer the only way to get that type of payoff. Exchange-traded funds (ETFs) have entered the same territory with products commonly called buffer ETFs. Like market-linked GICs, buffer ETFs are designed to limit downside risk while offering some participation in market gains.
As a retail investor, it is reasonable to be cautious here. Added complexity often comes with higher costs, more fine print, and a steep learning curve. When investors own products they do not fully understand, it becomes harder to stay invested through normal market ups and downs, regardless of how the product is designed to work.
Here is what you need to know about buffer ETFs and market-linked GICs in 2026. That includes the key trade-offs, the costs that are easy to overlook, and my honest take on whether either option makes sense for risk-averse investors, beginners and veterans alike.
How market-linked GICs work
A market-linked GIC’s principal is protected if you hold the investment to maturity, and it is typically eligible for Canada Deposit Insurance Corporation (CDIC) coverage, subject to the usual limits. The difference shows up in how your return is calculated.
Instead of earning a fixed interest rate for the full term, the return on a market-linked GIC depends on the performance of a specific market benchmark. That benchmark could be a stock index or another predefined group of securities. If the benchmark performs well, your return increases. If it performs poorly, your return falls back to a guaranteed minimum.
To see how this works in practice, consider the market growth GICs offered by TD Bank. One option is linked to a basket of major Canadian banks and is available in three-year and five-year terms in most registered accounts.
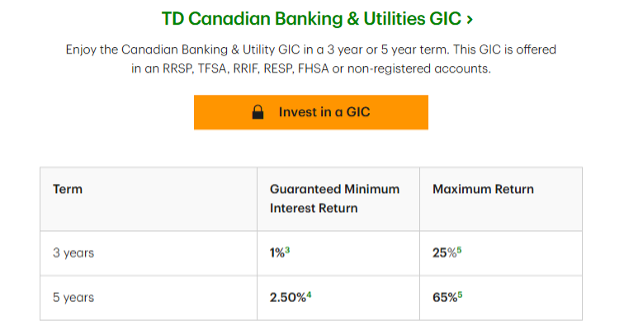
Source: TD, January 2026
For the three-year version, the guaranteed minimum return is 3.5%. For the five-year version, the guaranteed minimum return is 8%. If the linked bank basket performs poorly, that minimum is what you receive at maturity. You cannot lose money as long as you hold the GIC to the end of the term.
However, the upside participation is capped. Over three years, the maximum cumulative return is 18%. Over five years, the maximum cumulative return is 32%. Importantly, these figures are not annualized. They represent the total return over the entire life of the investment.
The fine print matters here. TD discloses that the 8% minimum return over five years works out to about 1.55% per year. The same logic applies to the maximum return. A 32% total return over five years sounds attractive, but once translated into an annualized figure, it looks far more modest.
Source: TD, January 2026
This structure highlights the core trade-off. You are free of downside risk, but you also give up a large portion of the upside. If the underlying market performs exceptionally well, the return above the cap does not accrue to you.
That leads to the obvious question of incentives. Banks earn fees for structuring and distributing these products. This is part of the reason market-linked GICs can be attractive for issuers even when they appear conservative on the surface.
Another common issue is investor misunderstanding. Many people confuse cumulative returns with annualized returns and assume the headline numbers are yearly figures; others assume the maximum return is what they are likely to receive, when in reality it is simply the upper boundary. Actual outcomes can land anywhere between the guaranteed minimum and the cap, depending entirely on how the underlying benchmark performs over the term.
For investors considering a market-linked GIC, understanding those mechanics is essential. The protection is real, but so are the limits.
Compare the best HISAs rates in Canada
How buffer ETFs work
The idea of narrowing the range of possible outcomes by limiting both downside and upside is no longer confined to market-linked GICs. Buffer exchange-traded funds aim to offer a similar payoff profile, but they do so with important structural differences that investors need to understand.
The most important distinction is that buffer ETFs are not principal protected; there is no guarantee you will receive your original investment back at the end of the outcome period, which is typically one year. Unlike GICs, these products are also not eligible for CDIC protection.
In exchange for taking on that risk, buffer ETFs generally offer more upside potential than a market-linked GIC. To see how this works, it helps to look at the buffer ETF lineup from BMO.
BMO’s buffer ETFs use the S&P 500’s price appreciation (not total return) as their reference index. This is primarily achieved via an allocation to BMO’s own S&P 500 ETF hedged to Canadian dollars, ZUE.
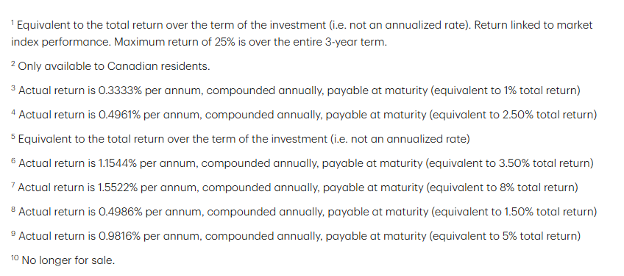
To create the buffer itself, these ETFs rely on a package of options, often bespoke over-the-counter contracts. These options act like training wheels, limiting losses over a predefined range, but also capping upside.
Source: BMO, January 2026
This is a key difference from a market-linked GIC. GICs protect against all downside if held to maturity. Buffer ETFs only absorb an initial slice of losses, and that protection does not reset within the year.
Timing also matters. The buffer is time-dependent and only applies in full if you buy the ETF at the start of the outcome period and hold it until the end. If you buy midway through the year, part or all of the buffers may already be used up, leaving you with less protection than expected.
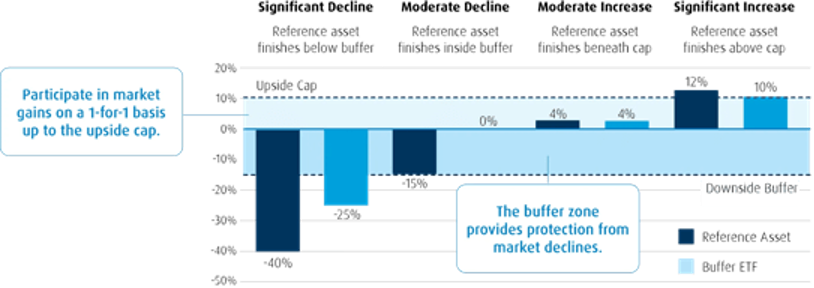
To address this, buffer ETF providers issue multiple versions of the same strategy tied to different start dates, known as vintages. BMO, for example, offers January, April, July, and October vintages, such as ZJAN, ZAPR, ZJUL, and ZOCT.
Source: BMO, January 2026
These give investors more entry points, but they also add complexity and require careful monitoring. This is one reason these products are more commonly used by advisors who are familiar with the mechanics and can manage the timing.
Take BMO’s January vintage buffer ETF, ZJAN. For its current outcome period, which runs from the third Friday of January 2026 to the third Friday of January 2027, the ETF aims to provide protection against the first 15% of losses in the S&P 500.
That protection is partial, not absolute. If the index falls more than 15% during the outcome period, the buffer is exhausted. For example, if the S&P 500 declines 20%, the ETF would fall by roughly 5%.
The downside protection is not free. It is financed by selling future upside. For the current outcome period, the January vintage buffer ETF has an upside cap of 7.9%.
That means the maximum return you can earn over the year is 7.9%, assuming the S&P 500’s price return reaches or exceeds that level. If the index rises 10% or 15%, anything above the cap is forfeited.
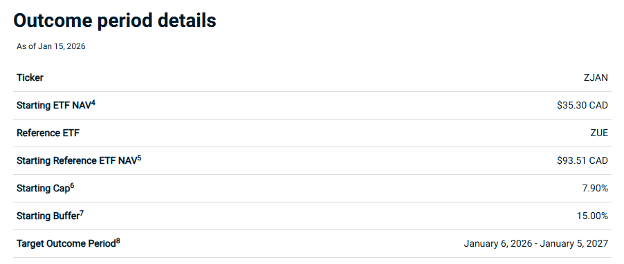
Source: BMO, January 2026
Costs add another layer to the decision. The management expense ratio on this buffer ETF is around 0.73%. That is roughly nine times higher than a plain-vanilla S&P 500 index ETF. For investors already giving up upside beyond the cap, those higher fees further reduce expected returns.
Buffer ETFs can make sense for some risk-averse investors who value a narrower range of outcomes and are comfortable with the trade-offs. But they require close attention to timing, a clear understanding of what is given up, and acceptance that the protection is limited rather than absolute.
Are market-linked GICs and buffer ETFs worth it?
Whether either of these products is worth owning depends on your starting point. Think about an investor who has spent their entire life holding traditional GICs or parking cash in a savings account.
Stocks feel different. Prices change constantly, and that can be unsettling, especially if most of your savings are at stake. For investors like this, simply getting some exposure to markets and earning a return that has a chance of outpacing inflation may be a meaningful step forward.
Yes, market-linked GICs and buffer ETFs come with higher fees, capped upside, and real complexity under the hood. But for someone who would otherwise stay entirely on the sidelines (or panic sell stocks in a downturn), they can function as a gentler, more mentally acceptable entry point.
The investing industry has learned that throwing people straight into volatile markets is rarely productive. Just as no one expects a beginner swimmer to jump into the deep end without flotation, some investors need an intermediate step. For them, these structured products can serve that role.
For more experienced investors with a lower risk tolerance, I personally think these products are unnecessary, expensive, and overtly complex.
For an alternative, consider the following back test of two portfolios from January 2016 through December 2025. The first held 100% in a Canadian dollar-hedged S&P 500 index ETF (VSP). The second held 60% in that same equity ETF and 40% in cash, rebalanced once per year.
This period includes several meaningful market stress events. There was the March 2020 pandemic selloff, the 2022 bear market, and the April 2025 tariff driven drawdown.
| Portfolio performance statistics | ||
| Metric | 100% stocks | 60/40 stocks/cash |
| Start balance | $10,000 | $10,000 |
| End balance | $34,419 | $23,485 |
| Annualized return (CAGR) | 13.16% | 8.91% |
| Standard deviation | 15.22% | 9.04% |
| Best year | 30.17% | 18.77% |
| Worst year | -19.25% | -10.67% |
| Maximum drawdown | -24.90% | -14.46% |
| Sharpe ratio | 0.77 | 0.79 |
| Sortino ratio | 1.16 | 1.19 |
Source: Portfolio Visualizer, January 2026
The all-equity portfolio delivered an annualized return of about 13.2%. Volatility was higher, with year-to-year swings of roughly 15%. The best year was just over 30%, the worst was about -19%, and the maximum peak-to-trough drawdown reached nearly 25% during the 2022 downturn.
The 60% equity and 40% cash portfolio told a different story. Annualized returns came in at about 8.9%, already higher than the current upside cap on many buffer ETFs. Volatility dropped to roughly 9%. The best year was just under 19%, the worst year was around -11%, and the maximum drawdown was reduced to about 14.5%.
The takeaway is not that structured products never have a place. It is that investors with experience and an understanding of portfolio construction often do not need them. Better risk and return profiles can be achieved with basic building blocks like stocks, bonds, and cash, combined with disciplined rebalancing.
For cautious investors taking their first steps into markets, market-linked GICs and buffer ETFs may offer comfort and a sense of control. But for those who already understand how volatility works and can tolerate it, there is usually a more straightforward and cheaper way to get where you want to go.
Get free MoneySense financial tips, news & advice in your inbox.
Read more about investing with ETFs:
- Why Canadian investors should avoid MLPs
- If not bonds, then what?
- Can you hedge against a market crash with ETFs?
- Covered call ETFs have high yields but come with a trade-off
The post Buffer ETFs vs. market-linked GICs: Which is better? appeared first on MoneySense.


You May Also Like

Trump may have signed his own death sentence with this imbecilic outburst

Crypto Presale Update: Pepeto Passes $8M as Dmail Shutdown Puts Listed Tokens at Risk