Monero Price Forecast: XMR bears take control of momentum
- Monero price breaks below its ascending trendline, signaling a potential bearish move ahead.
- Derivatives data paints a bearish picture as XMR short bets are increasing among traders.
- The technical outlook suggests a correction ahead as momentum indicators flip to bearish.
Monero (XMR) price is showing early signs of weakness on Tuesday after its price, currently at around $320, broke below the ascending trendline and traders' short positions on the token are rising. The technical outlook suggests a potential correction ahead, as momentum indicators indicate that bears are currently in control.
Monero’s bearish bets are rising
Coinglass's data shows that the long-to-short ratio of Monero reads 0.82 on Tuesday, the lowest level in more than a month. This ratio, below one, indicates bearish sentiment in the markets, as more traders are betting on Monero's price to fall.
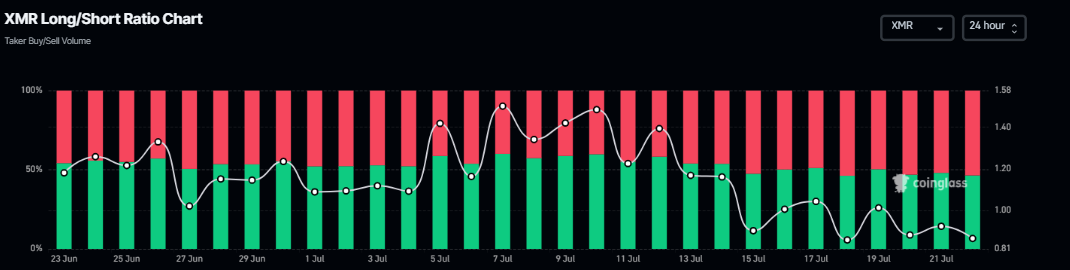
Monero long-to-short ratio chart. Source: Coinglass
Monero Price Forecast: XMR momentum indicators show bearish signs
Monero price broke and closed below its ascending trendline (drawn by connecting multiple lows since mid-June) on Friday. XMR found support around the 50-day Exponential Moving Average at $320.01 during the weekend, but failed to close above this broken trendline.
Similarly, on Monday, it again faced rejection from the trendline and closed below its 50-day EMA at $320.01. At the time of writing on Tuesday, it trades at around $321.21.
Sidelined investors looking to short XMR can do so around the current trading levels with the stop-loss set slightly above its Monday high of $332.43.
If XMR faces correction from the level mentioned above, it could extend the decline to retest its July 1 low of $301.71, which roughly coincides with the 100-day EMA at $305.14. A successful close below this would extend the losses to retest the June 22 low of $288.83.
The Relative Strength Index (RSI) indicator on the daily chart reads 46, pointing downward and below its neutral level of 50, which suggests mild bearish momentum. Additionally, the Moving Average Convergence Divergence (MACD) also showed a bearish crossover on Monday, giving a sell signal.
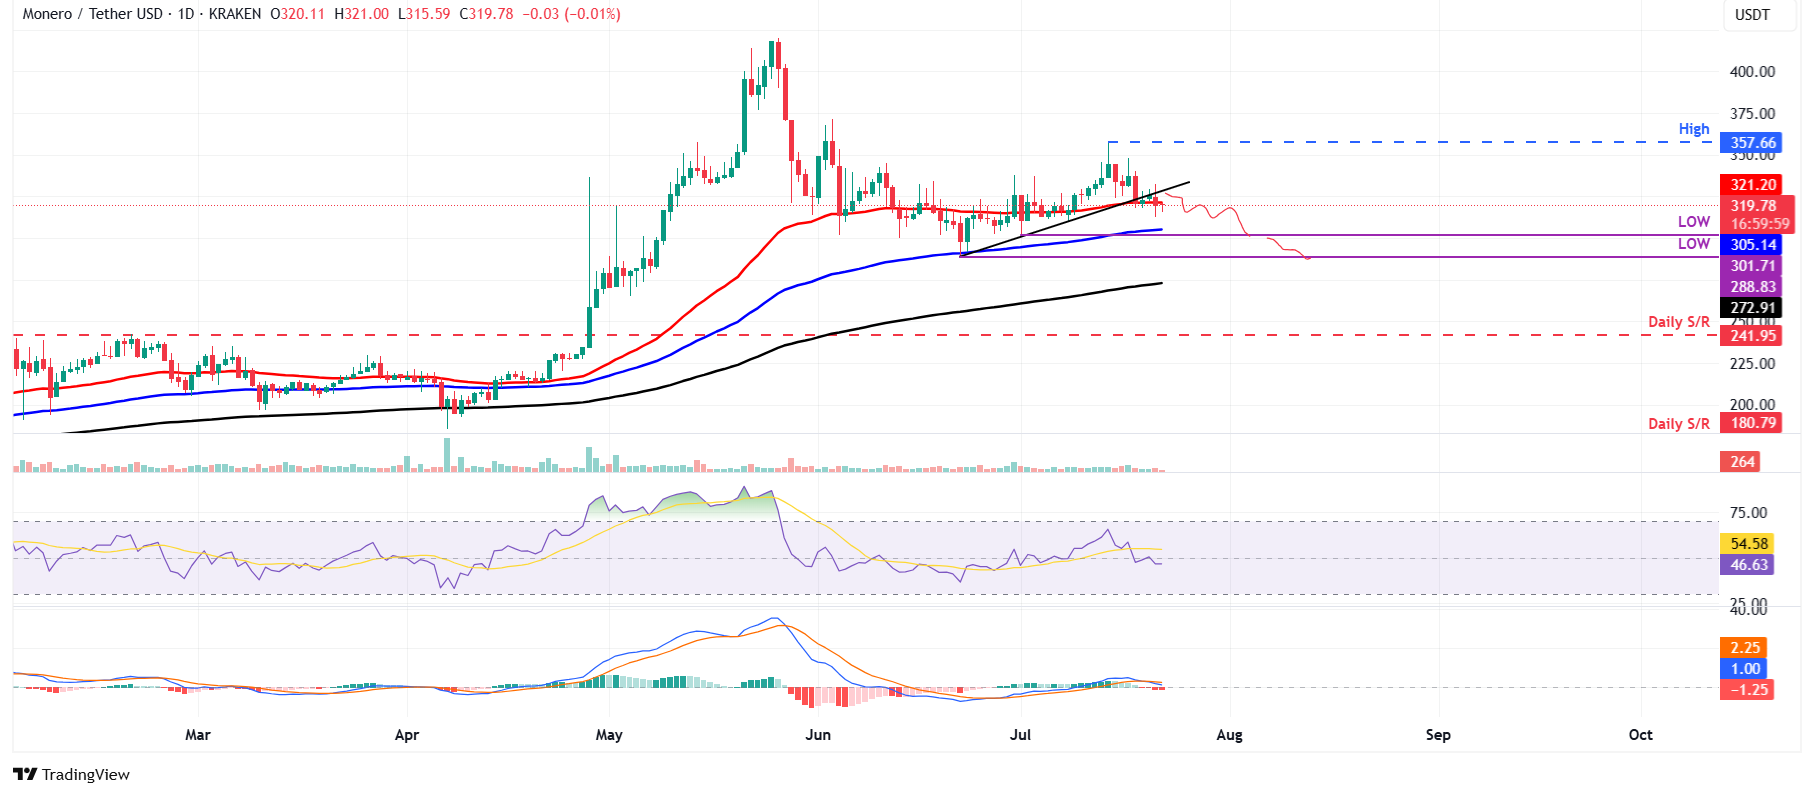
XMR/USDT daily chart
However, if the Monero price closes above Monday's high of $332.4 on a daily basis, the bearish thesis would be invalidated. Such a scenario could extend the rally toward the July 14 high of $357.66.


You May Also Like

White House Announces Major U.S.–China Trade Deals
Goldman Sachs crypto ETF holdings drop XRP and Solana in Q1 2026 filing