

BNB Prints Red Candles: Is a Heavy Breakdown Risk Ahead or a Breather Before a Bounce?
- BNB hovers at $849, slipping 5%.
- Trading volume skyrockets 112%.
A 5.11% drop set the tone for the day, sending waves of red across the crypto market. Along with the Fear and Greed Index value of 28, the broader market sentiment hangs in fear. The majority of the token charts are nosediving, losing all the recently acquired momentum, including Bitcoin (BTC) and Ethereum (ETH), which lost 6% each in value.
Meanwhile, BNB has posted a solid 5.58% drop over the last 24 hours. In the early hours, the asset traded at a high range of $904.44. With the bearish shift in the BNB market, the price retraced toward a bottom level of $836.09. The current loss made it trade at $849.43, with trading volume exploding by 112% to $4.35 billion. Besides, the BNB market has seen $4.48 million liquidated.
On the 4-hour trading chart, the BNB/USDT pair unveils a bearish pattern, with red candle formation. The price could fall to support at $844.27. With further deep corrections on the downside, it might trigger the emergence of the death cross, and the bears would send the price below $839.11.
On the upside, assuming BNB reverses the momentum bullish, with green candles, it might push the price up to the $854.73 resistance. More pressure on the upside could initiate the formation of the golden cross. Also, the potent bulls may take the altcoin price to its recent high at around $859.80 or higher.
Bearish Pressure Builds on BNB’s Technical Charts
BNB’s Moving Average Convergence Divergence (MACD) and signal lines are found below the zero line, pointing toward its bearish zone. The price is trading below its longer-term average, showing weakness. Notably, any brief bounce is seen as a relief move, not a full trend reversal, unless the lines start moving back above zero.
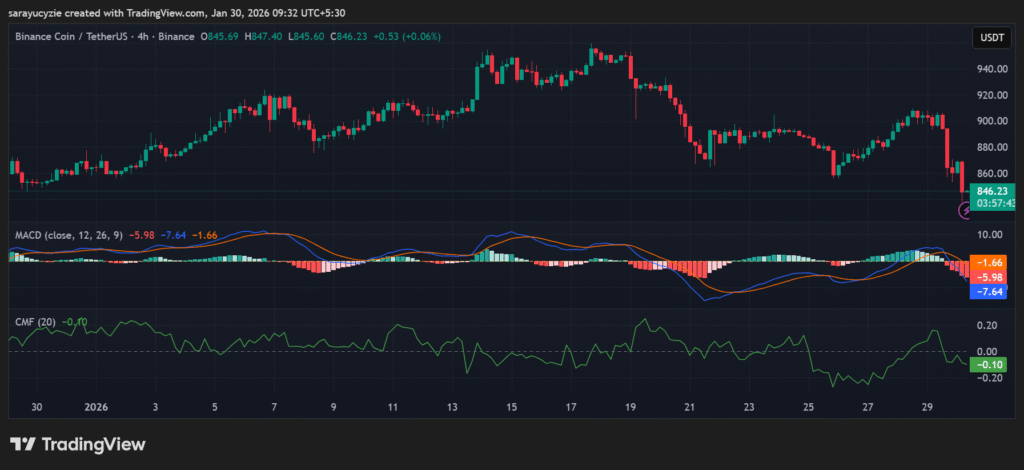 BNB chart (Source: TradingView)
In addition, the asset’s Chaikin Money Flow (CMF) indicator, resting at -0.10, hints that the capital is flowing out of the asset more than it is flowing in. As the selling pressure is slightly dominant, there is weak accumulation. Also, it reinforces a bearish bias, particularly if the ongoing price action is not strongly supported.
The daily Relative Strength Index (RSI) is positioned at 33.55, indicating that the asset is approaching oversold territory. The selling pressure may be losing strength, and this zone delivers a possible chance of a relief bounce, though not a reversal signal. Moreover, BNB’s Bull Bear Power (BBP) reading of -51.94 suggests the bears are firmly in control. The price is trading below and displaying a strong downtrend. The bullish attempts to push it higher are being overpowered, and any bounce is likely corrective.
Top Updated Crypto News
Japan’s Metaplanet Plans $137M Capital Raise to Increase Bitcoin Reserves


You May Also Like

Iran mediators propose 45-day ceasefire amid low US-Iran resolution odds: FT

Bitcoin hits weekly low on oil fears as analyst teases $10K BTC price target


