Extreme fear and heavy sell-off shape Bitcoin price today as signs of exhaustion emerge

Markets are deep in a risk-off phase, with Bitcoin price today showing aggressive selling, forced de-risking, and the first signals that downside momentum may be tiring.
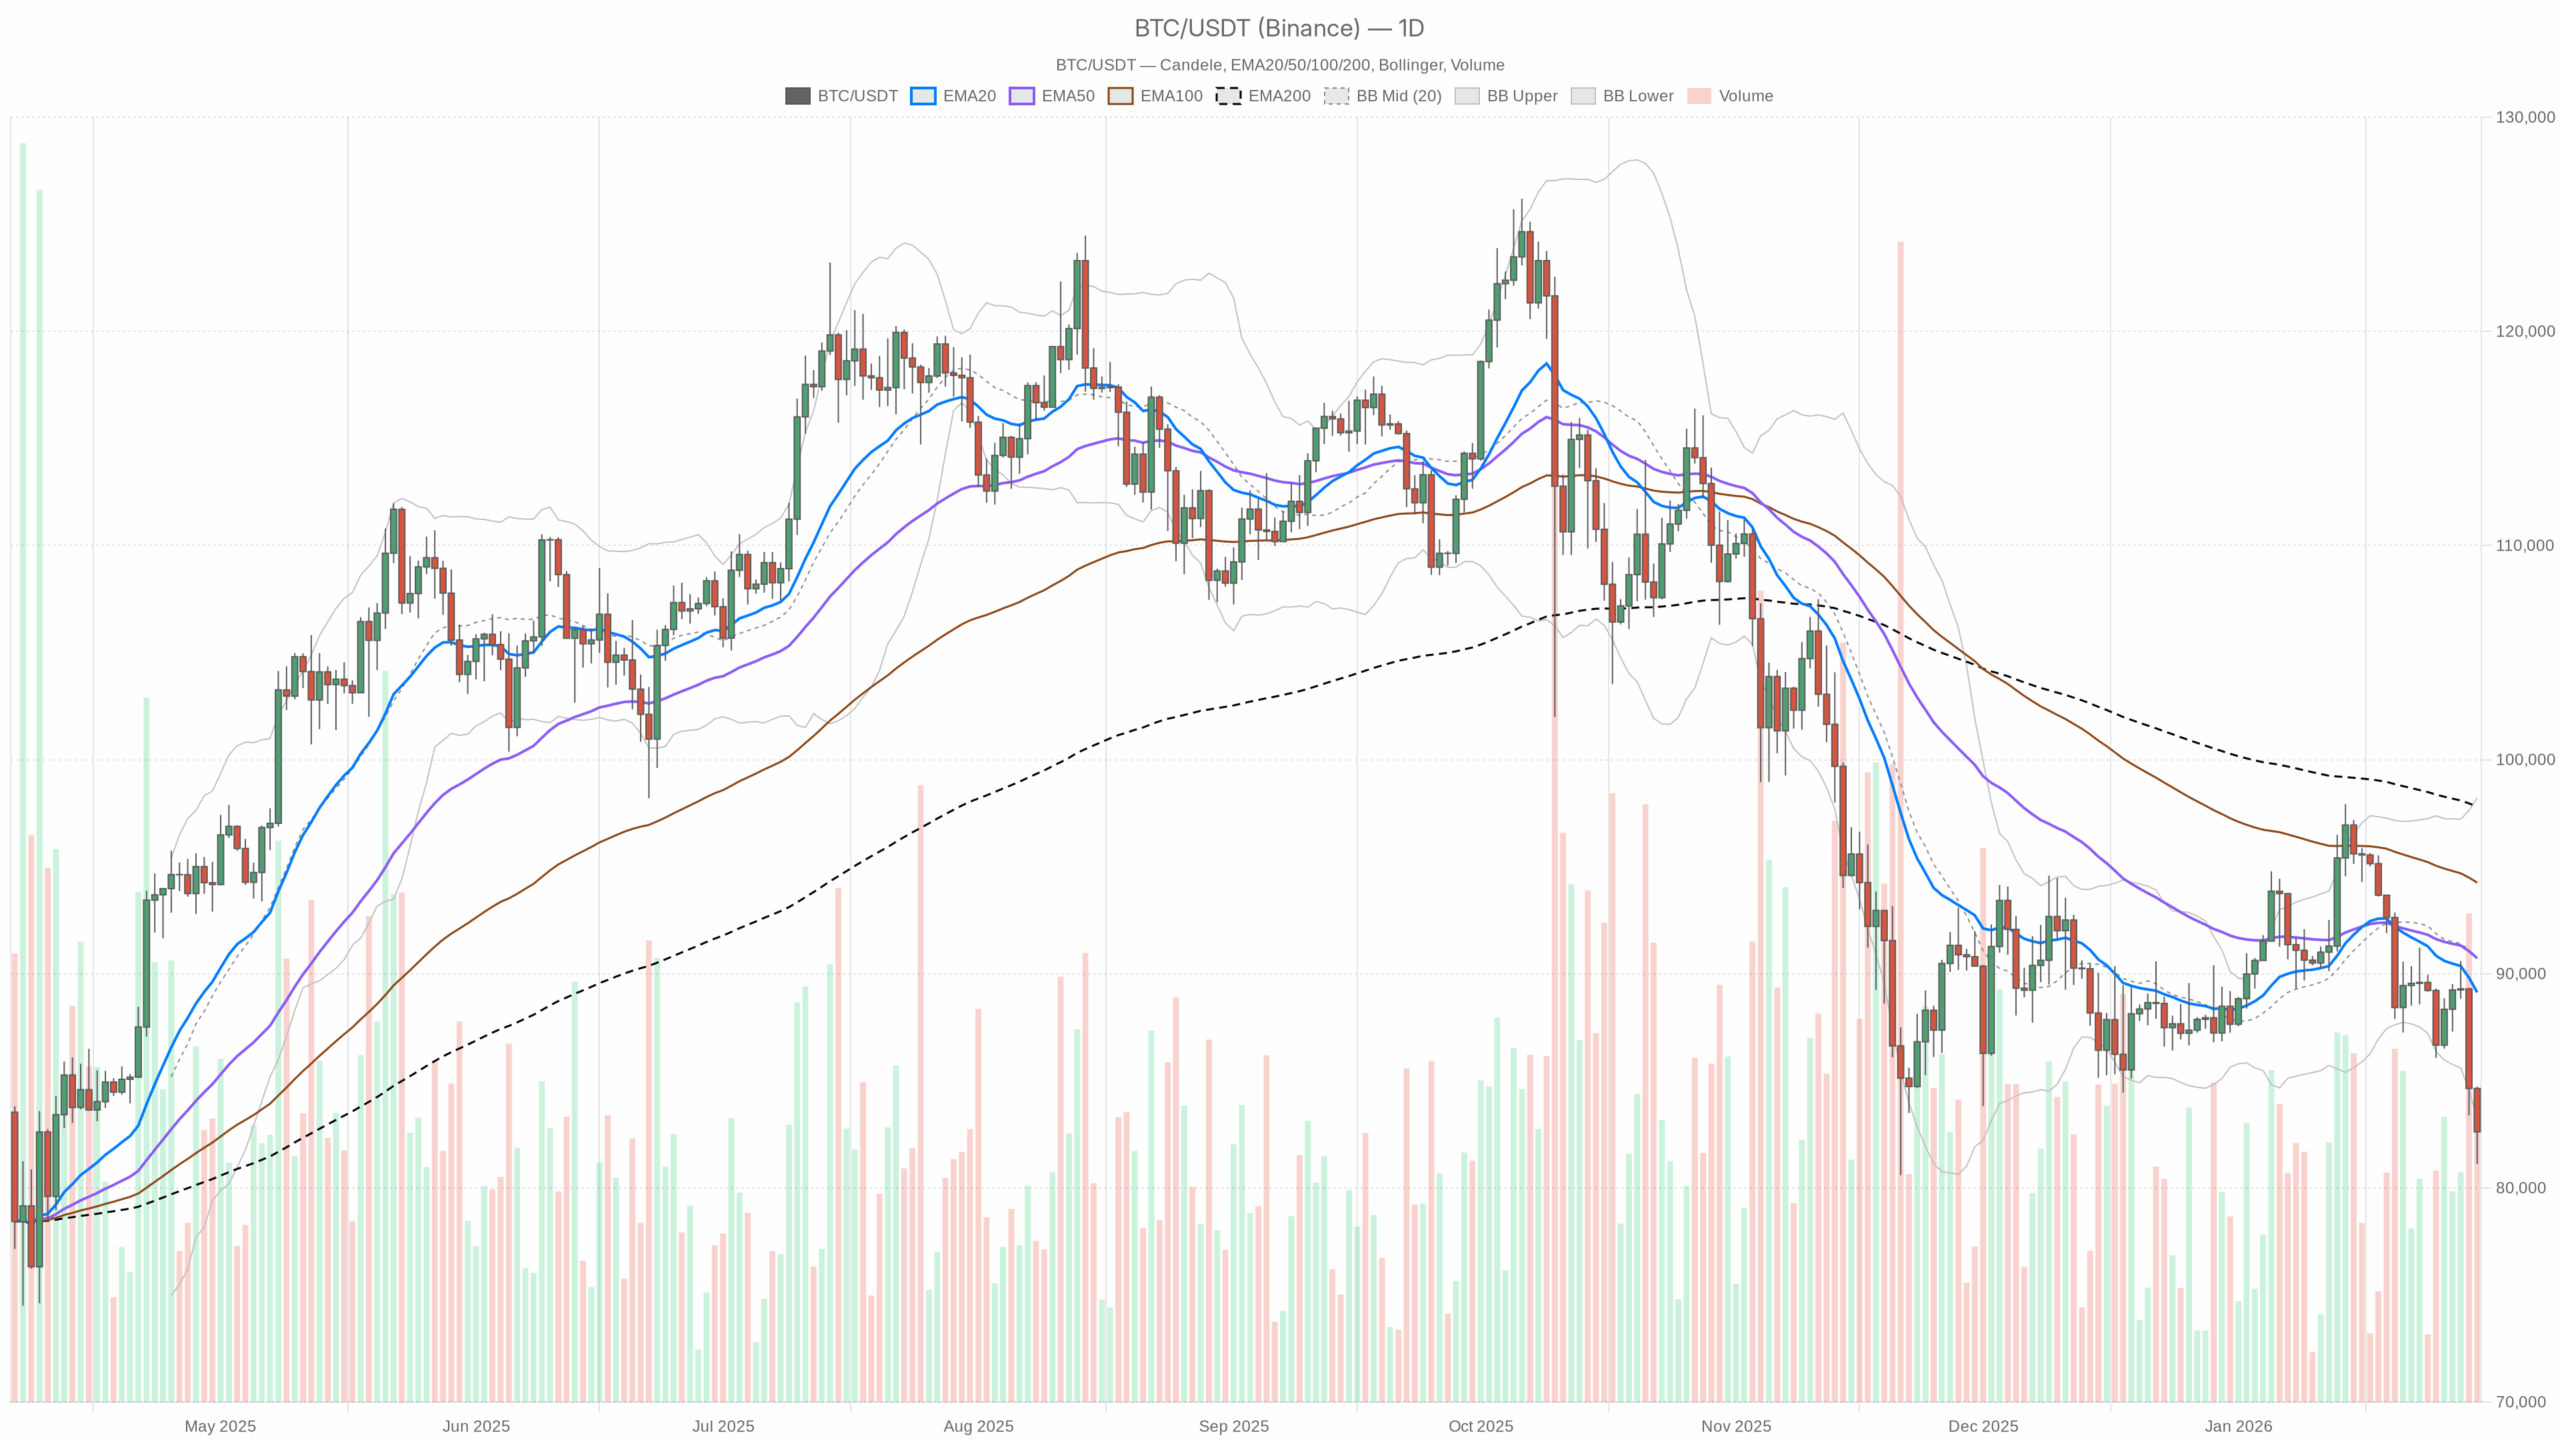 BTC/USDT — daily chart with candlesticks, EMA20/EMA50 and volume.
Daily chart (D1): macro bias – bearish, but approaching exhaustion
Trend structure: EMAs
– Price: $82,623
– EMA 20: $89,136
– EMA 50: $90,731
– EMA 200: $97,809
Bitcoin is trading well below the 20, 50 and 200-day EMAs, with a clean bearish stack (price < EMA20 < EMA50 < EMA200). That is a textbook downtrend. The gap of roughly 7–8k between spot and the 20-day EMA shows how sharp the sell-off has been; the market is not simply drifting lower, it has been repricing quickly.
Interpretation: Trend followers are in control. Moreover, any bounce into the $89k–91k area is, by default, a potential rally into resistance unless BTC can reclaim and hold above the 20-day EMA for several sessions.
Momentum: RSI (14)
– RSI 14 (D1): 30.75
Daily RSI is sitting right on the edge of oversold territory. We are not in a panic capitulation zone yet, but selling pressure is heavy and persistent.
Interpretation: Bears are clearly in charge, but they are starting to lean on the same side of the boat. From here, each additional leg down has a higher probability of triggering a reactionary bounce as short-term sellers get exhausted and value buyers start to step in.
Trend quality: MACD
– MACD line: -1457.54
– Signal line: -563.08
– Histogram: -894.45
The daily MACD is deeply negative, with the MACD line well below the signal line and a wide negative histogram.
Interpretation: The medium-term downtrend has strong momentum behind it. There is no confirmed slowdown on the daily MACD yet; sellers are still pushing hard. For a sustainable trend reversal, we would first need the histogram to contract toward zero; right now it is still telling us the bears are not done.
Volatility & range: Bollinger Bands and ATR
– Bollinger mid-band (20 SMA): $90,720
– Upper band: $98,213
– Lower band: $83,226
– Price: $82,623
– ATR 14 (D1): $2,645
Price is now trading just below the lower Bollinger Band. Combined with an elevated ATR above $2.6k, that tells us the market is in a high-volatility, stretched-down move.
Interpretation: When price lives below the lower band with ATR this high, the market is in a liquidation / forced unwind zone. That is where sharp, short-lived mean reversion bounces often start. However, as long as BTC cannot get back inside the bands (above roughly $83.2k) and then back toward the mid-band, the macro remains decisively bearish.
Short-term levels: daily pivots
– Pivot point (PP): $82,826
– First resistance (R1): $84,533
– First support (S1): $80,916
BTC is hovering right around the daily pivot, slightly below it. R1 at $84.5k is the first real intraday line the bulls need to reclaim; S1 near $81k is the immediate risk level below.
Interpretation: As long as price holds between PP and S1, we are in a fragile balance zone. A decisive break below $81k would likely unlock another wave of selling, while a move back above $84.5k would be the first evidence that a short-term bounce is getting traction.
1-hour chart (H1): bears still in control, early stabilization attempts
Trend: EMAs
– Price: $82,664
– EMA 20: $84,094
– EMA 50: $85,971
– EMA 200: $88,441
On the hourly chart, price remains below all main EMAs, with the same bearish alignment we see on the daily. The gap to the 20-EMA is smaller here than on D1, which is typical after a strong flush. The market is trying to consolidate below resistance rather than waterfall straight down.
Interpretation: The H1 structure confirms the daily bearish bias. Any bounce toward $84k–86k is, for now, just a move back toward hourly trend resistance.
Momentum: RSI (14)
– RSI 14 (H1): 30.07
The hourly RSI is almost identical to the daily: right at the edge of oversold.
Interpretation: Intraday selling has been heavy, but momentum is no longer accelerating. This is the kind of setup where you often see choppy, sideways-to-slightly-up price action as the market digests the move.
Trend quality: MACD
– MACD line: -1295.98
– Signal line: -1310.55
– Histogram: +14.57
Interestingly, while both MACD line and signal are deep in negative territory, the histogram has just turned slightly positive.
Interpretation: Bears are still ahead overall, but the downside momentum on the hourly is starting to lose steam. This is not a buy signal on its own, but it is the first technical hint of potential short-term basing.
Volatility & range: Bollinger Bands and ATR
– Bollinger mid-band: $84,021
– Upper band: $86,000 (approx, actual $86,999)
– Lower band: $81,043
– ATR 14 (H1): $825
BTC is trading close to the lower hourly band, with an intraday ATR near $800. That is a wide hourly range, consistent with elevated volatility and stop-driven moves.
Interpretation: On the 1-hour chart, selling pressure is still dominant, but the band structure combined with a slowing MACD histogram favors sideways chop with violent spikes rather than a smooth new leg straight down.
Intraday levels: hourly pivots
– Pivot point (PP): $82,699
– First resistance (R1): $82,960
– First support (S1): $82,403
Price is sitting almost on top of the hourly pivot.
Interpretation: The intraday battlefield is very narrow. A push above $82,960 opens the way toward $84k+ retests, while a slip under $82,400 increases the odds of probing $81k daily support. This is a market where intraday traders need to accept swift invalidations on either side.
15-minute chart (M15): execution zone – fragile bounce attempt
Trend: EMAs
– Price: $82,685
– EMA 20: $82,781
– EMA 50: $83,385
– EMA 200: $86,010
On the 15-minute chart, price is now slightly below the 20-EMA but trying to reclaim it. The 50-EMA and especially the 200-EMA remain much higher.
Interpretation: Very short-term, BTC is no longer in free fall; it is trying to carve out a local floor just under $83k. However, any bounce into $83.3k–84k is still counter-trend and likely to meet supply from trapped longs and new shorts.
Momentum: RSI (14)
– RSI 14 (M15): 46.37
The 15-minute RSI has recovered to mid-range.
Interpretation: Intraday momentum has shifted from one-sided selling to a more neutral, two-way market. This supports the idea of a short-term consolidation band rather than an immediate extension lower.
Trend quality: MACD
– MACD line: -148.67
– Signal line: -193.89
– Histogram: +45.23
The 15-minute MACD is still negative overall, but the MACD line is above the signal line and the histogram is distinctly positive.
Interpretation: On the micro timeframe, sellers have clearly lost the upper hand for now. This is what an early-stage bounce or base-building phase normally looks like. It is still inside a larger downtrend, but short-term traders are starting to buy dips instead of dumping every candle.
Very short-term range: Bollinger Bands, ATR, pivots
– Bollinger mid-band: $82,802
– Upper band: $83,304
– Lower band: $82,300
– ATR 14 (M15): $319
– Pivot point (PP): $82,643
– First resistance (R1): $82,727
– First support (S1): $82,602
Price is nudging the 15-minute pivot and trying to trade back inside the mid-upper half of the bands, with a 15m ATR around $300.
Interpretation: Very short-term, BTC is attempting a grind higher within a tight but volatile band. Breaks above $83.3k would signal that the intraday bounce has some real strength; failure to hold above $82.3k would put the downside back in play quickly.
Market context: risk-off, high fear and rotation into defensives
Total crypto market cap is around $2.89T, down almost 5.8% in 24h, while BTC dominance is above 57%. That combination tells you capital is fleeing alts faster than Bitcoin and crowding into perceived safer large caps or out of crypto altogether.
At the same time, mainstream coverage is focusing on Bitcoin holders looking at equities and gold as alternatives, while large institutional-style buyers are still adding BTC on weakness, according to the recent news flow. Layer on top the Extreme Fear sentiment reading of 16, and you get a market where the marginal seller is emotional, not strategic.
Interpretation: Structurally, this is a risk-off environment with Bitcoin still the relative winner inside a losing asset class. Moreover, this is often where medium- to long-term accumulation quietly starts, but for short-term traders, it remains an environment dominated by whipsaws and liquidation spikes.
Scenarios from here
Main bias: bearish with oversold bounce risk
The daily chart defines the main scenario: bearish trend, with a growing risk of a counter-trend bounce due to stretched conditions. Lower timeframes show early attempts at stabilization, but they have not flipped the overall structure.
Bullish scenario (counter-trend bounce / start of a bottoming process)
In the constructive scenario, BTC defends the $81k S1 daily support area and builds a base between $81k and $84k. The signs to watch:
1. On the 15m and 1h, price holds above the local pivots ($82.6k–82.7k) and starts printing higher lows.
2. H1 MACD histogram continues to turn more positive, and RSI climbs back into the 40–50 range instead of living near 30.
3. Price reclaims the lower daily Bollinger Band and stabilizes above ~$83.3k, signalling that the immediate liquidation phase is cooling off.
4. Extension target for a basic mean reversion would be the region around the H1 EMA 50 / daily pivot cluster in the $86k–89k zone, with the daily EMA 20 at ~$89k as the upper bound of a normal corrective rally.
What invalidates the bullish scenario?
A clean break and daily close below $81k, especially if accompanied by a new expansion in daily MACD downside and RSI pushing decisively below 30, would argue the bounce has failed and the downtrend is resuming with force.
Bearish scenario (trend continuation / deeper leg down)
In the dominant scenario, BTC fails to build a solid base here and the oversold condition simply fuels brief, weak bounces that get sold into.
Key signs this is playing out:
1. Price repeatedly rejects the $84k–85k area (daily R1 and H1 mid-band) and cannot hold above intraday EMAs.
2. H1 and M15 MACD histograms roll back negative after this brief improvement, and RSI on H1 stays pinned close to 30.
3. BTC loses $81k support with strong volume and trades comfortably below the lower daily Bollinger Band, with ATR staying elevated or expanding.
In that case, the market would be pricing in a deeper flush. The next logical zones are prior structural supports and round-number magnets below. Levels like the high-$70k region would come into focus, where longer-term participants may have interest and where RSI would likely dip into clear oversold territory.
What invalidates the bearish scenario?
A sustained reclaim of the daily EMA 20 around $89k, backed by a clear contraction in the daily MACD histogram and RSI recovering toward the mid-40s, would weaken the trend-following bearish case. It would not flip the market into a full bull on its own, but it would mark a transition from a trending-down regime to a more range-bound or base-building one.
How to think about positioning now
This is a market dominated by volatility, fear and forced positioning. The daily trend is down; any strength is guilty until proven innocent. At the same time, we are close enough to oversold territory and close enough to the lower Bollinger Band that pressing entirely new, unhedged shorts carries meaningful squeeze risk.
Short-term traders will likely focus on the $81k–84k band as the immediate decision zone. Breaks outside this range, especially during high volume periods, can lead to fast, directional moves. Longer-term participants will pay more attention to how BTC behaves around the $89k daily EMA 20 on any rebound: does it get sold aggressively, or can it be reclaimed and defended?
Regardless of bias, position sizing and risk limits matter more than usual here. With daily ATR above $2.6k and intraday ATRs in the hundreds of dollars, the market can move against a position very quickly. Assumptions about fair value mean far less, in the short run, than respecting the levels where a trade idea is clearly wrong. In this context, monitoring Bitcoin price today can help traders align their risk with the prevailing volatility regime.
If you want to monitor markets with professional charting tools and real-time data, you can open an account on Investing using our partner link:
Open your Investing.com account
This section contains a sponsored affiliate link. We may earn a commission at no additional cost to you.
Disclaimer: This analysis is for informational and educational purposes only and is based on the data provided. It is not investment, trading, or financial advice, and it does not take into account your individual circumstances. Markets are volatile and unpredictable; always do your own research and consider your risk tolerance before making any trading decisions.


You May Also Like

Strategy (MSTR) Stock Jumps Back Into Buy Mode After Bitcoin Pause

Solo Bitcoin Miner Wins $210K After 1-in-28,000 Odds