

Why Bitcoin’s Drop Doesn’t Look Like a Cycle Top
Bitcoin is transitioning into a cooldown phase rather than a full-cycle breakdown, according to multiple on-chain cycle indicators.
While price has pulled back meaningfully from recent highs, the structure shown across cycle oscillators suggests the market is releasing excess leverage and volatility instead of entering a deep capitulation regime.
Cycle Extreme Oscillator Signals Pressure Relief, Not Capitulation
The Bitcoin Cycle Extreme Oscillator shows that recent price weakness has not been accompanied by sustained or clustered extreme readings. During the latest decline, Bitcoin moved from the $120,000–$125,000 area down toward the $85,000–$90,000 zone. However, extreme spikes on the oscillator appeared only briefly and faded quickly.
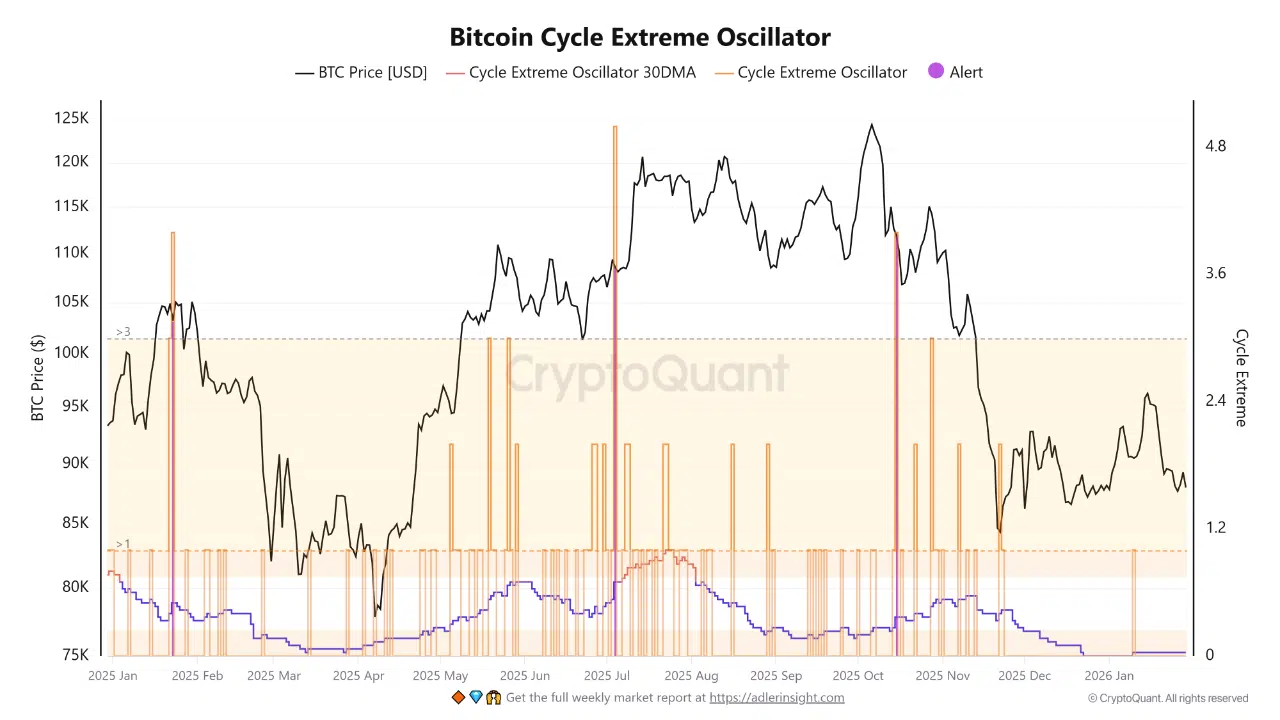 Historically, major cycle tops are characterized by persistent, repeated extreme readings while price continues to grind higher. In contrast, the current structure shows short-lived extremes followed by normalization, indicating localized profit-taking rather than synchronized speculative excess. The declining 30-day average reinforces this view, pointing to gradual pressure release instead of structural breakdown.
Cycle Extremes Index Confirms Mid-Range Market Conditions
The Bitcoin Cycle Extremes Index further supports a cooling narrative. The index currently sits around 28–30%, placing it firmly in the mid-range and well below historical bull-market extreme zones. Bull extreme signals that were visible during the Q3 rally have weakened noticeably, while bear extremes remain scattered and unclustered.
Price action aligns with this reading. Bitcoin has retraced into the $88,000–$95,000 range, but drawdowns from the cycle peak remain contained relative to past crash regimes. Volatility percentile has expanded from compressed levels, suggesting redistribution and position rebalancing rather than panic-driven deleveraging.
Drawdowns Remain Orderly as Structure Holds Above Crash Zones
From a structural standpoint, Bitcoin is trading below prior cycle highs but has not entered deep crash territory. Previous crash phases required sustained drawdowns well beyond current levels, typically accompanied by aggressive downside acceleration and persistent cycle extremes. Neither condition is present in the current data.
Instead, the charts show a market that has cooled from excess, shed leverage, and stabilized above major breakdown thresholds. Until extreme signals begin clustering again, or drawdowns accelerate materially below the $80,000 region, the data supports a transitional macro phase rather than a confirmed cycle reset.
Bottom Line
On-chain cycle indicators point to cooling, not collapse. Bitcoin has corrected sharply from the $120K+ highs, but the absence of sustained extreme readings suggests the market is digesting gains rather than unwinding a full bull cycle. For now, the structure reflects consolidation and redistribution, not systemic stress.
The post Why Bitcoin’s Drop Doesn’t Look Like a Cycle Top appeared first on ETHNews.


You May Also Like

Q2 Market Insights: Bitcoin regains dominance in risk-averse environment, ETFs remain critical to market structure

Nebius Revenue Skyrockets 684%: Why the "Pennsylvania AI Factory" Is the New Frontier for AI Infrastructure


