

Zora (ZORA) Price Prediction 2026-2030: Can ZORA Hit $0.100 Soon?
- Zora’s bullish momentum suggests potential breakout above $0.0400 resistance soon.
- Key technical indicators point to steady growth for Zora’s price.
- Zora could reach $0.100 by 2030 with strong momentum.
Zora enters 2026 showing signs of bullish recovery after spending weeks in a consolidation range. The price is currently rebounding from lower support levels and has shown significant strength in the short term. With strong momentum and technical indicators suggesting a potential break above key resistance levels, there is an increasing possibility that ZORA could see further gains in the years ahead. Can it hit $0.100 by 2030?
Market Context and Price Action
Zora’s recent price action suggests that the token is transitioning from a phase of corrective pressure into one of bullish momentum. After rejecting support from the lower Bollinger Band near $0.0219, buyers began stepping in, driving the price back to the mid-range. This led to a significant upward move, with the token seeing a sharp green daily candle, marking a more than 68% price increase in a single day. This sudden surge in price indicates renewed buyer interest and suggests the market sentiment is shifting positively.
Despite the increase in price, volatility remains relatively compressed compared to earlier periods, suggesting that Zora is accumulating energy for its next major move. If the price continues to rise and breaks through key resistance levels, it could set the stage for further bullish growth in the coming months.
Also Read: Caldera (CAL) Price Prediction 2026–2030: Can CAL Hit $0.560 Soon?
Current Market Overview
At the time of analysis, Zora is trading around $0.0374, well above the 20-day Simple Moving Average (SMA) of $0.0320. The lower Bollinger Band sits around $0.0241, while the initial resistance level is marked at $0.0398. This resistance level is an important hurdle for Zora’s continued upward momentum. A successful breakout above this level could confirm a shift to a more bullish outlook.
This structure indicates that Zora is in a favorable position, with strong support levels beneath and significant resistance above. If Zora can break above the resistance at $0.0398, it would likely lead to a rally towards the $0.0400 level.
Technical Analysis
From a technical standpoint, Zora is showing early signs of recovery, but it remains below key resistance levels. Momentum is gradually improving, with the Relative Strength Index (RSI) at 56.06, which suggests that Zora is not yet overbought, leaving room for further upside. However, confirmation of a bullish trend requires the price to break above the $0.0400 resistance level, which would act as a key milestone for confirming that Zora is in the early stages of a broader upward trend.
Bollinger Bands
The Bollinger Bands on the daily chart indicate that the price is moving toward the upper band after a bounce from the lower band. This bounce from support at $0.0219 is technically positive, suggesting that the downside momentum has temporarily stalled. However, to signal a full trend reversal, a decisive breakout above the upper band at $0.0400 is required. If the price closes above this level, it could trigger an expansion of volatility and a move toward higher price levels.
RSI Behavior
The RSI is currently at 56.06, reflecting moderate bullish momentum. While this is not an extreme overbought condition, it does suggest that the price could continue its upward move, especially if the RSI moves above 60. If the RSI drops below 50, it could indicate a weakening of momentum, which might result in a pullback or further consolidation before any continued upward movement.
Support and Resistance Levels
Zora’s immediate support lies at $0.0320, which aligns with the 20-day SMA. This level is crucial for maintaining the bullish outlook; as long as the price stays above this level, the bullish case remains intact. Below this, there is stronger support at $0.0241, marked by the lower Bollinger Band. A break below this level would raise the risk of further downside movement.
On the upside, the price faces resistance at $0.0398, which is just below the upper Bollinger Band. A breakout above this resistance would open the door for further price appreciation toward $0.0400, and beyond that, the next target would be $0.0450. Reaching and breaking through these resistance levels would signal a sustained upward trend for Zora.
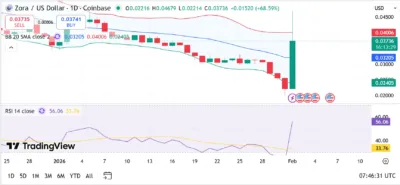
Source; Tradingview
Zora Price Predictions (2026–2030)
| Year | Minimum Price | Average Price | Maximum Price |
|---|---|---|---|
| 2026 | $0.027 | $0.040 | $0.060 |
| 2027 | $0.035 | $0.050 | $0.070 |
| 2028 | $0.045 | $0.055 | $0.085 |
| 2029 | $0.055 | $0.080 | $0.100 |
| 2030 | $0.070 | $0.090 | $0.120 |
2026
In 2026, Zora is expected to remain in a range-bound phase with intermittent volatility expansion. If the price holds above the $0.0320 support level, a gradual upside continuation toward $0.060 remains possible, especially during favorable market conditions. A break above $0.0400 could push the price toward the upper end of this range.
2027
By 2027, Zora could see a more established trend, with stronger market participation and clearer bullish structure. Prices could average around $0.050, with potential for further appreciation to $0.070 if momentum continues to build. The market may also see more liquidity flowing into Zora, supporting its price growth.
2028
Zora’s outlook in 2028 could be more optimistic as the broader altcoin market expands. With sufficient liquidity and continued momentum, Zora could trade comfortably above $0.050, reaching the $0.085 mark during strong market cycles. The token may become a more prominent asset as its ecosystem grows.
2029
As Zora matures, its volatility may stabilize, and accumulation zones could form above the $0.055 support level. The token could see a significant rally toward $0.100 as long-term trends continue to develop favorably. By the end of 2029, Zora could potentially hit $0.100 if strong market conditions persist.
2030
By 2030, Zora’s long-term price will be heavily influenced by broader adoption and ecosystem development. If market conditions remain favorable, Zora could reach a maximum price of $0.120, establishing itself as a more established asset in the cryptocurrency space.
Conclusion
Zora enters 2026 with a technically positive outlook after rebounding from lower support levels and showing signs of bullish momentum. While the price remains below key resistance levels, the improving market conditions and technical indicators suggest that a breakout could occur in the near future. If Zora can break above $0.0400, it may open the door for further upside, with potential for long-term growth toward $0.100 by 2030.
FAQs
1.What is the current market sentiment for Zora in 2026?
Market sentiment is cautiously bullish, supported by a significant recovery from lower support levels.
2. Is Zora overbought right now?
No. The RSI remains in a neutral-bullish range, leaving room for further upside.
3. What levels must Zora hold to stay bullish?
Holding above $0.0320 is critical to maintaining the bullish structure.
4. What resistance should traders watch?
Key resistance lies at $0.0398, with the next major resistance at $0.0400.
5. What is Zora’s long-term outlook?
Zora could continue appreciating through 2030, with a potential to reach up to $0.120 during peak market cycles.
Also Read: Bitcoin Price Prediction 2026: Can BTC Break Above $90,000 Soon?
The post Zora (ZORA) Price Prediction 2026-2030: Can ZORA Hit $0.100 Soon? appeared first on 36Crypto.


You May Also Like

Live markets: bitcoin on sidelines as markets surge on Iran peace hopes
Trump knows 'he’s dying' and he wants it all — quickly: analysis

FTX Sets July 31 for First Creditor Payouts, Files Revised Plan to Free Up $600 Million


