Is The Bitcoin Bottom In? CMT Reveals What Investors Need To See Now
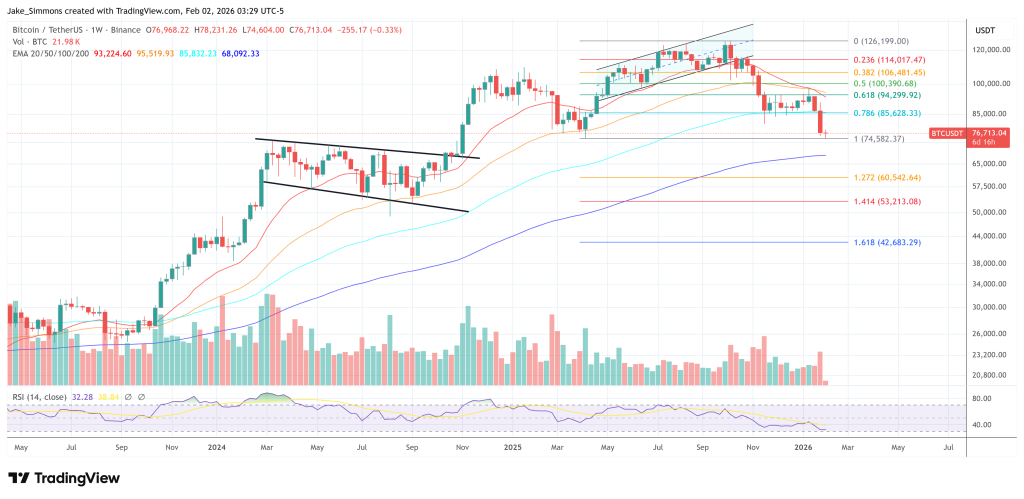
Bitcoin slid sharply over the weekend, breaking below $76,000 in thin trading and briefly dipping through the $75,000 area as selling accelerated late Saturday into Sunday. The move pushed BTC into a zone that technician Aksel Kibar has identified as a key band of horizontal support, roughly between $73.7K and $76.5K.
The move didn’t come in a vacuum. Macro markets were already in a forced-risk-off posture, with a violent sell-off in precious metals feeding broader deleveraging dynamics, exactly the kind of tape that can amplify weekend volatility when liquidity thins out and stop levels get tested.
Is The Bitcoin Bottom In?
Kibar, a Chartered Market Technician and the founder of Tech Charts LLC, said in a series of posts on X that he’s watching the $73.7K and $76.5K closely, but not treating it as an automatic green light for longs. His message to traders: price reaching support is a location, not a signal, and the difference matters most when you’re trying to avoid catching a falling knife.
In several posts dated Jan. 30 and Feb. 1 he stated that his process is built around classical chart patterns rather than “guessing” the low. “Reaching a support area is not in itself a classical chart pattern buy signal,” he wrote. “We need to see a bullish reversal chart pattern forming around support areas. But trading tactics differ. You might have a different way to take advantage of the recent price action.”
Kibar framed the current range as an area where a bottom could form, but emphasized that his approach is to wait for structure, specifically a reversal formation that changes the odds profile. On Jan. 30 he laid out why he won’t chase a level just because it’s on the map.
“I’m not interested to find the support because I’m not trying to catch the falling knife,” he wrote. “I’m interested to find a bottom reversal pattern. A double bottom. A H&S bottom. I will always miss the boat if it is a V reversal.” That trade-off is deliberate, he added, and it’s part of knowing your own constraints: “Important to know your strength and weaknesses.”
In a separate post, Kibar linked the “base building” concept to a concrete trigger: a breakout above $91.2K, which he described as the completion point of a double-bottom scenario he had referenced earlier. “When I say we need a base building, some sort of a classical chart pattern (preferably with horizontal boundaries), I’m referring to the breakout above 91.2K (completion of a double bottom),” he wrote, adding that confirmation is “even more crucial because we are below long-term average,” before he can “submit for bullish interpretation.”
Kibar’s posts also pushed back on a common psychological trap in bottom-calling: confusing caution with fear. Responding to an X user who suggested he sounded bullish but reluctant to “make a call” to avoid being wrong, Kibar agreed with the setup but sharpened the motive.
“Everything correct,” he replied. “Except not I don’t want to be wrong but to have higher conviction. We can’t act in markets with the fear of being wrong.”
That distinction matters because it explains why his framework requires visible evidence of buyers stepping in, rather than a single level holding by default. When another user asked whether Bitcoin could be forming the right shoulder of a potential head-and-shoulders bottom, Kibar dismissed the timing: “Too early to start thinking about this.”
In his most recent update, Kibar described the kinds of behaviors that, in his view, can hint at demand emerging around support. Instead of treating it as a checklist, he framed it as the “signs” that can show buyers are willing to defend the area: a pickup in activity and volatility, candlesticks that show rejection(such as doji-like structures with long lower wicks) and short-term reversal structures like double bottoms or head-and-shoulders bottoms.
Kibar also introduced a market-structure point he said he learned while managing a large fund in the United Arab Emirates: “If there are no sellers, there will be no buyers.” He argued that large buyers often need meaningful supply to build size without moving price against themselves, and that heavy selling can sometimes be the condition that allows that accumulation, depending on motives and liquidity.
He briefly extended that idea to Strategy (formerly MicroStrategy), noting he wasn’t sure whether the firm “will be required (from an accounting perspective) to sell any assets,” but adding that, in his words, the market can be a “wild wild west,” where “some buyer out there might be after that chunk at a reasonable price.”
At press time, Bitcoin traded at $76,713.
You May Also Like

Telos Advisers Welcomes Stephen Gardner as a Strategic Advisory Board Member

CEO Sandeep Nailwal Shared Highlights About RWA on Polygon