

Thin Liquidity and Volatility Behind Bitcoin’s Move Toward $74K
The recent Bitcoin rebound above $75,000 has captured global attention across trading floors, digital asset forums, and institutional research notes. After a sudden 12% decline that pushed prices near critical support zones, BTC price recovery surprised even seasoned market observers. Bitcoin rebounds above $75,000 at a time when
Bitcoin market volatility remains elevated, and investor confidence is fragile. With Bitcoin price today hovering approximately at $75,710.32, analysts are assessing whether this move signals a temporary bounce or the start of a sustainable rally.
This sudden shift from panic to optimism underscores how BTC drops and rebounds continue to define modern crypto cycles. As Bitcoin traders on edge scrutinise every chart movement, concerns around Bitcoin thin liquidity, Bitcoin weekend trading behaviour, and BTC short liquidation patterns dominate Crypto market today conversations.
Market Snapshot: Bitcoin Price Today and Trading Metrics
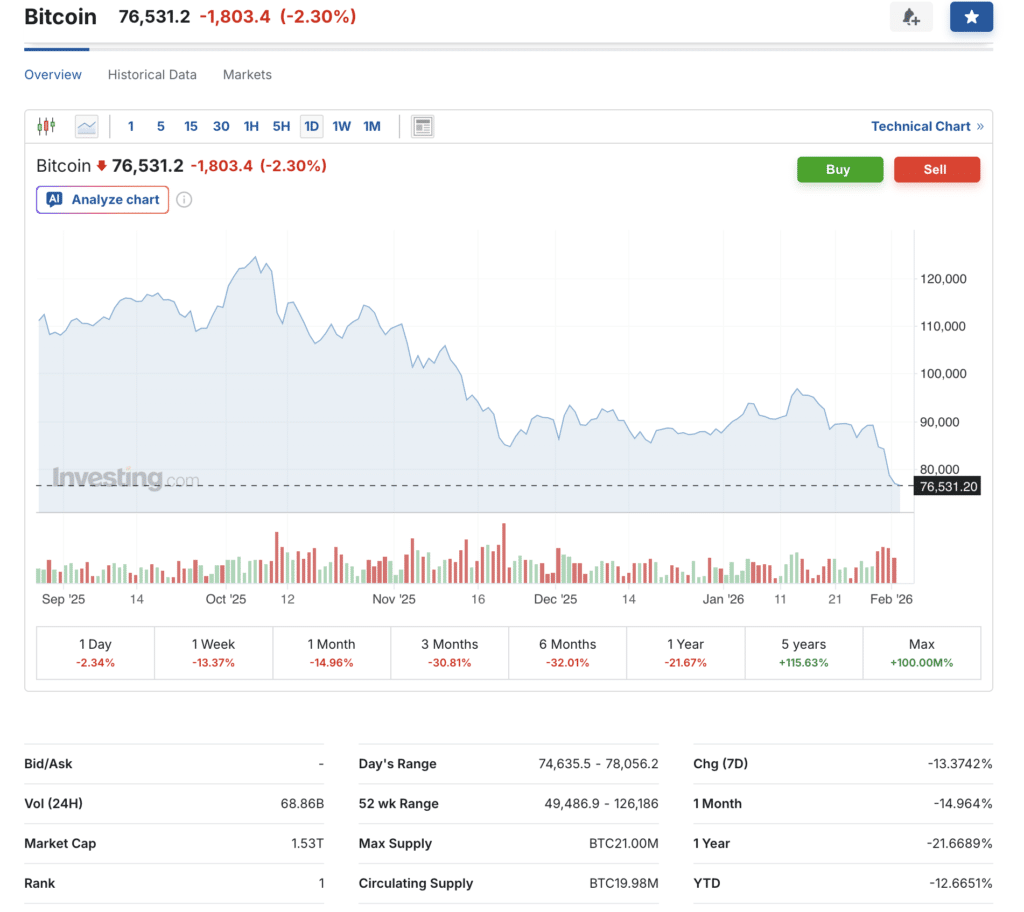
Bitcoin price today reflects a market caught between recovery and caution. At approximately $75,710.32, BTC trades near around major resistance levels while maintaining a market capitalisation of roughly $1.51 trillion. The 24-hour trading volume near around $66.6 billion signals sustained institutional and retail interest despite recent turbulence. Bitcoin rebounds above $75,000 in an environment where liquidity remains uneven and sentiment continues to shift rapidly.
Bitcoin is currently down approximately 3.79% over the last 24 hours, reminding traders that BTC price recovery is rarely linear. With circulating supply near approximately 19.98 million coins and a maximum cap of 21 million, scarcity continues to underpin long-term valuation models. Yet in the short term, Bitcoin thin liquidity volatility can distort price discovery, especially during off-peak trading hours.
 Thin Liquidity and Volatility Behind Bitcoin’s Move Toward $74K 3
What Triggered the 12% Price Drop?
Understanding why Bitcoin falls then recovers in 2026 requires examining both structural and psychological drivers. The recent downturn was largely fuelled by aggressive deleveraging in derivatives markets, compounded by thin order books during weekend sessions. Bitcoin weekend trading often amplifies volatility, and this episode proved no exception. A wave of BTC short liquidation and forced long closures accelerated downside momentum.
Macroeconomic uncertainty also played a role. Concerns around interest rate trajectories, geopolitical tensions, and risk-off sentiment pushed capital toward traditional safe havens. As a result, Bitcoin price today briefly slipped below critical technical zones. When it comes to trading values, price levels near around $72,000 triggered automated sell orders, deepening the slide before buyers re-entered.
Bitcoin Rebounds Above $75,000: Anatomy of the Recovery
The Bitcoin rebound above $75,000 unfolded with remarkable speed. Within hours of hitting local lows, institutional desks and high-frequency traders began accumulating positions. This coordinated buying activity stabilised the order book and reversed negative momentum. BTC price recovery was further supported by spot market inflows and renewed ETF-related demand.
Bitcoin rebounds above $75,000 often coincide with renewed confidence in long-term fundamentals. In this case, blockchain activity metrics, wallet accumulation data, and stablecoin inflows suggested strategic repositioning rather than speculative frenzy. The recovery also highlighted how Bitcoin support level 75000 continues to function as a psychological and technical anchor during volatile phases.
 Thin Liquidity and Volatility Behind Bitcoin’s Move Toward $74K 4
Thin Liquidity and Its Role in Volatility
Bitcoin thin liquidity remains one of the most underestimated drivers of abrupt price movements. During periods of reduced participation, even moderate sell pressure can generate outsized market reactions. This recent episode demonstrated how shallow depth near around key price zones can amplify both losses and recoveries.
When Bitcoin rebounds above $75,000 under thin liquidity conditions, it often reflects aggressive market-making interventions. Professional traders exploit temporary inefficiencies, restoring equilibrium. However, thin liquidity volatility also increases vulnerability to manipulation and flash crashes. As Crypto market today evolves, improving liquidity infrastructure remains essential for long-term stability.
Comparative Perspective: Previous BTC Drops and Rebounds
Historically, BTC drops and rebounds have followed a familiar pattern. From the 2018 bear market recovery to the 2021 correction cycle, Bitcoin price rebounds after dip scenarios consistently attracted strategic capital. The current Bitcoin rebound above $75,000 shares similarities with previous recoveries, particularly in terms of volume spikes and derivatives recalibration.
In 2024 and 2025, comparable drawdowns near around 10–15% were followed by multi-month consolidations before renewed rallies. Bitcoin falls then recovers in 2026 appear to mirror these historical rhythms. Analysts note that sustained BTC price recovery typically requires confirmation through higher lows, expanding volume, and stable macro conditions.
Trader Psychology: Why Sentiment Shifted So Fast
Market sentiment remains one of the most powerful forces in crypto valuation. During the recent sell-off, fear-driven narratives dominated social media and trading platforms. Yet once Bitcoin rebounds above $75,000, sentiment shifted almost instantly. This behavioural reversal reflects the reflexive nature of speculative markets.
Bitcoin traders on edge often oscillate between extreme caution and aggressive optimism. The rapid rebound restored confidence among swing traders and momentum funds. Anecdotal evidence from trading communities suggests many participants interpreted the recovery as proof of institutional backing. This psychological reinforcement further strengthened BTC price recovery momentum.
Institutional Influence and Market Structure
Institutional participation continues to reshape Bitcoin’s microstructure. Hedge funds, proprietary trading firms, and asset managers now dominate volume flows during major moves. The latest Bitcoin rebound above $75,000 coincided with increased activity in regulated derivatives venues and spot ETFs.
These entities employ sophisticated risk models that trigger accumulation near statistically significant levels. When it comes to trading values, institutional bids near around $73,000–$74,000 created a price floor. Their presence mitigated prolonged downside risk and accelerated recovery dynamics, reinforcing Bitcoin’s maturation as a financial asset.
Bitcoin Market Volatility and Risk Management
Bitcoin market volatility remains structurally higher than traditional asset classes. Sudden drawdowns and rapid recoveries are inherent to decentralised markets with 24/7 trading cycles. The recent BTC weekend crash recovery highlighted the importance of disciplined risk management.
Professional traders increasingly rely on volatility-adjusted position sizing, algorithmic hedging, and on-chain analytics. Bitcoin rebounds above $75,000 in such environments reward participants who maintain liquidity buffers and diversified exposure. Conversely, overleveraged positions remain highly vulnerable to liquidation cascades.
Technical Outlook: Support, Resistance, and Momentum
From a technical standpoint, Bitcoin support level 75000 remains critical. Sustained closes above this zone reinforce bullish structure, while breakdowns may invite renewed selling pressure. The current BTC price recovery has reclaimed key moving averages and trendlines, suggesting short-term stabilisation.
Momentum indicators near around neutral levels indicate consolidation rather than immediate continuation. Analysts tracking Bitcoin price today focus on resistance near approximately $78,000 and support near around $72,500. A decisive break in either direction could define near-term trajectory in Bitcoin market analysis February 2026.
Long-Term Fundamentals Behind the Recovery
Beyond short-term speculation, long-term fundamentals continue to support Bitcoin’s valuation. Network security, institutional custody solutions, and regulatory clarity have improved markedly. Bitcoin’s rebound above $75,000 partly reflects confidence in these structural developments.
Scarcity dynamics, driven by fixed supply and post-halving emission reductions, remain central to valuation models. As adoption expands in emerging markets and corporate treasuries, BTC price recovery aligns with broader digital asset integration trends. These factors reinforce long-term bullish narratives despite intermittent volatility.
BTC Price Prediction After Rebound
BTC price prediction after rebound remains a subject of intense debate. Some analysts anticipate consolidation around $75,000–$80,000 before renewed upward momentum. Others warn of potential retracements if macro conditions deteriorate. Is Bitcoin going up after $75K dip remains an open question.
Quantitative models suggest that sustained volume expansion and declining funding rates would favour further appreciation. Conversely, renewed leverage accumulation could reintroduce downside risk. Bitcoin price rebounds after dip. Scenarios historically require patience and confirmation before establishing long-term trends.
Conclusion
The recent Bitcoin rebound above $75,000 following a sharp 12% decline demonstrates the resilience and complexity of the cryptocurrency market. BTC price recovery has restored short-term confidence while highlighting ongoing challenges related to thin liquidity, market volatility, and trader psychology. As Bitcoin price today stabilises near key technical support levels, investors and traders must remain vigilant, balancing optimism with disciplined risk management.
Monitoring Bitcoin market volatility, institutional flows, and on-chain metrics will be crucial for anticipating future BTC drops and rebounds. This episode underscores the importance of data-driven strategies, careful analysis, and preparedness in navigating the ever-evolving crypto landscape. Bitcoin’s performance near $75,000 could define its trajectory in the weeks ahead, offering both opportunities and cautionary lessons for market participants.
Frequently Asked Questions About Bitcoin Rebound
Why did Bitcoin rebound above $75,000?
The rebound above $75,000 was driven by rapid accumulation from institutional and retail traders, combined with BTC short liquidations and renewed confidence at key support levels. Thin liquidity and weekend trading volatility amplified both the initial drop and the subsequent recovery.
What does BTC price recovery mean for traders?
BTC price recovery signals potential stabilisation after sharp declines. Traders can use it to gauge market sentiment, identify support zones like $75,000, and plan risk management strategies during periods of Bitcoin market volatility.
How does thin liquidity affect Bitcoin price?
Thin liquidity increases the likelihood of sharp price swings. Low order book depth means even moderate buy or sell orders can trigger exaggerated moves, causing BTC drops and rebounds to appear more dramatic than during high-volume periods.
Is Bitcoin likely to continue rising after the $75K rebound?
Short-term momentum appears bullish if Bitcoin maintains levels above key support zones. However, ongoing macro risks, derivatives market activity, and potential over-leveraged positions mean traders should remain cautious and monitor BTC price today closely.
How can Bitcoin weekend trading impact price movements?
Weekend trading often has lower volumes, which can exaggerate both downward and upward swings. BTC weekend crash recovery episodes, like the recent rebound, demonstrate how thin liquidity during off-peak hours can accelerate volatility.
What is the significance of Bitcoin support level 75000?
The $75,000 support level acts as a psychological and technical anchor. It influences trader behaviour and helps determine the strength of BTC price rebounds after dips. Breaking below it may signal further downside, while holding above it reinforces bullish sentiment.
How do BTC short liquidations influence market recovery?
Short liquidations occur when positions betting on price drops are forced to close. This buying pressure often contributes to rapid BTC price recovery after a sudden decline, as seen in the latest rebound above $75,000.
Appendix: Glossary of Key Terms
BTC Short Liquidation: Forced closure of short positions when prices rise sharply.
Market Capitalisation: Total value of circulating cryptocurrency supply.
Thin Liquidity: Low trading depth leading to exaggerated price movements.
Support Level: Price zone where buying interest tends to emerge.
Resistance Level: Price zone where selling pressure often increases.
Derivatives Market: Trading venues for futures and options contracts.
On-Chain Metrics: Blockchain-based data used for market analysis.
References
Bitcoin rebounds
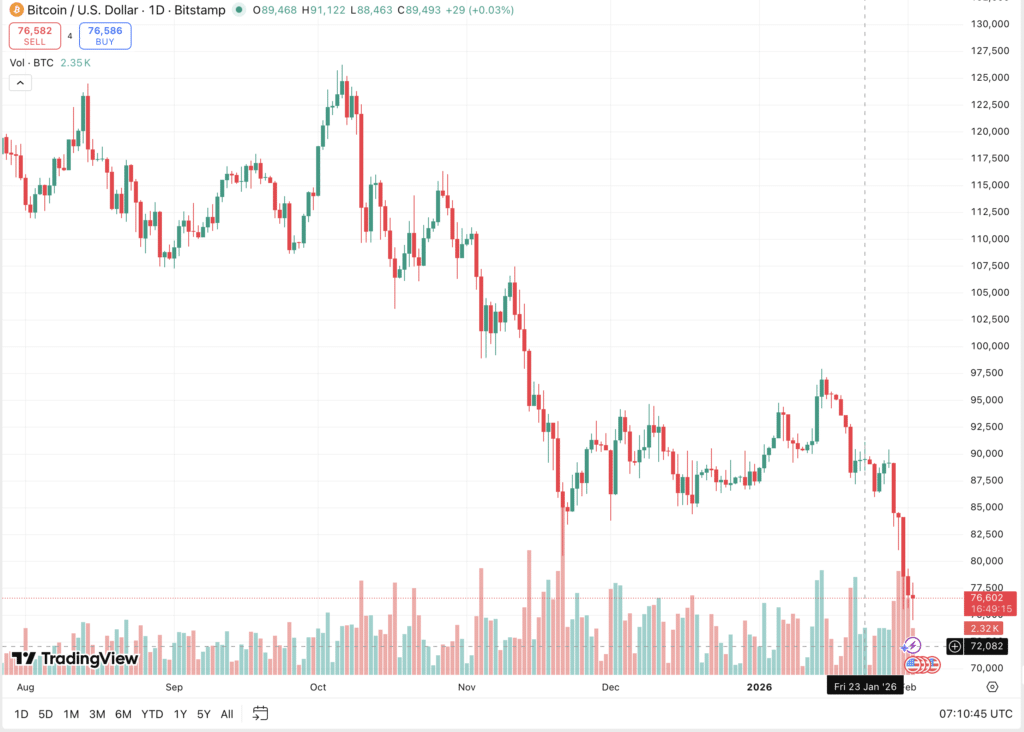
BTC/USD price chart
Read More: Thin Liquidity and Volatility Behind Bitcoin’s Move Toward $74K">Thin Liquidity and Volatility Behind Bitcoin’s Move Toward $74K


You May Also Like

Netflix (NFLX) Stock: Rome Court Declares Price Increases Unlawful, Mandates Customer Refunds

Netflix (NFLX) Stock: Italian Court Orders Refunds Over Illegal Price Hikes


