

Why Ethereum’s $2.2K Level Could Decide the Next Bull Run
This article was first published on The Bit Journal.
Ethereum price fell sharply over the weekend as selling pressure intensified across the crypto market. The decline erased recent gains and pushed the Ethereum price into a key technical zone. Market sentiment turned extremely bearish.
Ethereum Price Slides as Market Weakness Deepens
Ethereum price is down 17.38% from Saturday’s open at $2,702. At press time, ETH was down to around $2,219. The sell-off came as digital assets more broadly stumbled. Fear-driven trading dominated market behavior.
ETH is now at a critical juncture in terms of price. Near-term charts are extremely bearish-looking. Longer-term structure remains technically bullish. Data on liquidity, positioning in futures and momentum indicators are all signalling more volatility ahead.
Ethereum Price Weakens as Market Sentiment Turns Extreme
Ethereum price dropped as general market mood gravitated into extreme fear. The Fear and Greed Index dropped to 15. Such levels reflect panic-driven conditions. Extremely high fear has historically been seen near market bottoms.
Also Read: Ethereum Price Outlook: 3 Reasons Whale Execution Is Bullish
Bitcoin fell by a similar amount over the same period. General risk off environment has resulted in less interest for dip-buying. Sellers dominated the weekend sessions. This NEW pressure prevented any bounce of significance with Ethereum struggling to recover price.
| Month | Min. Price | Avg. Price | Max. Price | Change |
|---|---|---|---|---|
| Feb 2026 | $ 2,236.49 | $ 2,462.20 | $ 2,706.38 |
18.87%
|
| Mar 2026 | $ 2,360.73 | $ 2,861.47 | $ 3,441.80 |
51.17%
|
| Apr 2026 | $ 3,124.17 | $ 3,607.08 | $ 4,088.31 |
79.57%
|
| May 2026 | $ 3,243.11 | $ 3,701.97 | $ 4,275.74 |
87.80%
|
| Jun 2026 | $ 3,117.67 | $ 3,482.15 | $ 3,821.76 |
67.86%
|
| Jul 2026 | $ 2,846.72 | $ 2,915.29 | $ 3,002.77 |
31.89%
|
| Aug 2026 | $ 2,785.05 | $ 2,875.97 | $ 3,313.85 |
45.55%
|
| Sep 2026 | $ 2,682.15 | $ 3,187.96 | $ 3,524.35 |
54.80%
|
| Oct 2026 | $ 2,440.41 | $ 2,644.58 | $ 2,788.04 |
22.46%
|
| Nov 2026 | $ 2,583.71 | $ 2,721.26 | $ 2,874.31 |
26.25%
|
| Dec 2026 | $ 2,615.45 | $ 2,672.37 | $ 2,802.18 |
23.08%
|
Futures Liquidations Accelerate Ethereum Price Drop
Derivatives data shows that Ethereum price losses were amplified by futures liquidations. Total liquidations reached $266.53 million. Long positions accounted for roughly $204.38 million of that figure. Forced selling added momentum to the downside move.
High leverage increased market fragility. As prices slipped, stop-loss orders triggered rapidly. This cascade deepened losses and reinforced bearish momentum. Until leverage resets, Ethereum price may remain unstable.
 Source: TradingView
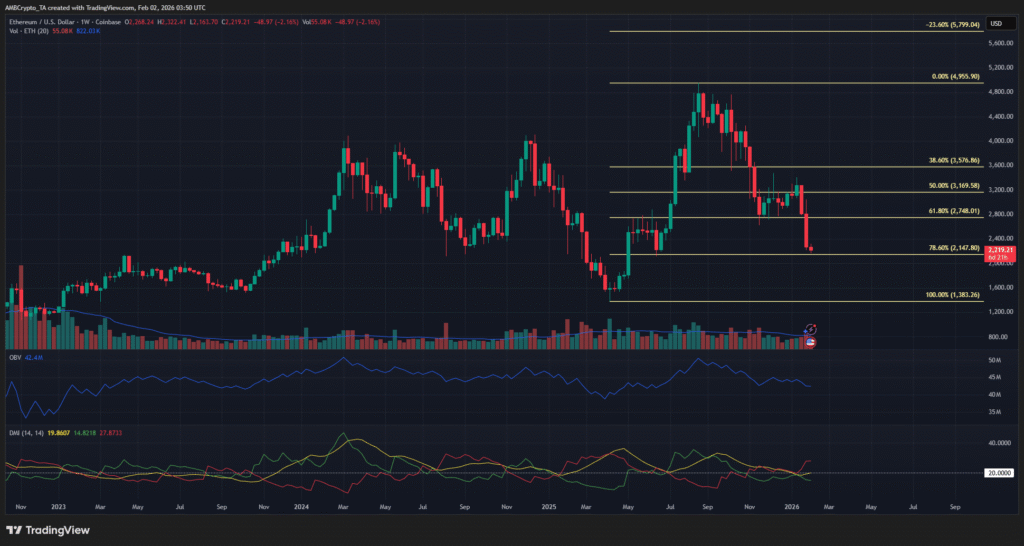
Weekly Chart Shows Bullish Structure Still Intact
Despite recent declines, the weekly chart presents a different picture. Ethereum price continues to trade within a broader bullish swing structure. This structure formed during the rally from $1,383 to nearly $4,955 in 2025.
Strong accumulation from a big holder supported that movement. We would need to close the week below $1,383 IF, that structure was to be invalid. Broad long-term trend biases are technically positive until then.
Institutional Buying Persists Despite Drawdowns
Institutional interest has not fully faded. Over the past month, Bitmine added 132,813 ETH to its balance sheet. This accumulation occurred despite a reported drawdown exceeding 40%.
Such positioning suggests long-term conviction. Institutions often buy during periods of stress. Their activity provides some structural support for Ethereum price, even as short-term weakness persists.
Fibonacci Retracement Highlights Key Ethereum Price Level
From a technical perspective, Ethereum price has retraced close to the 78.6% Fibonacci level. This level sits near $2,147. Markets often react strongly around deep retracement zones.
A brief move below this level remains possible. Analysts expect potential liquidity sweeps before any recovery attempt. Failure to hold this area could expose lower price targets.
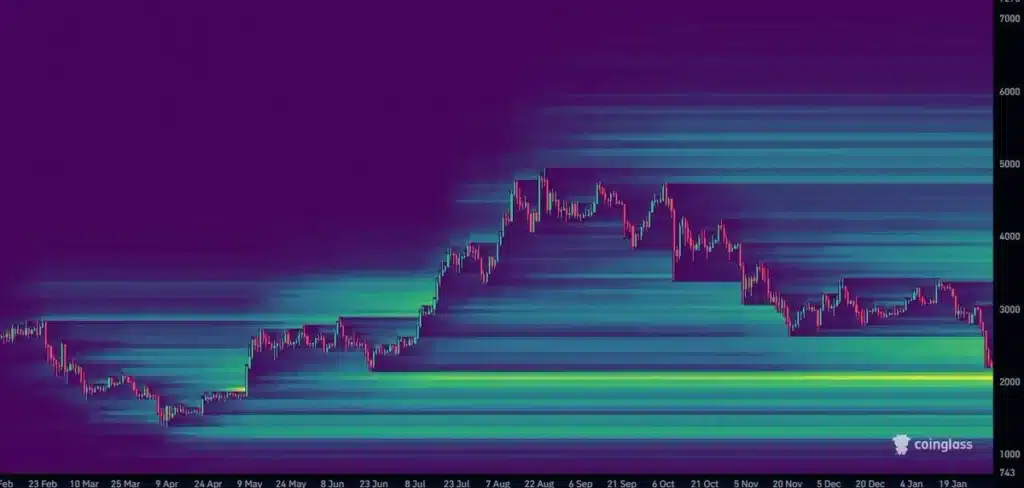
Liquidity Data Points to $2,100 Magnet Zone
Liquidity heatmaps reveal a dense cluster around the $2,100 level. Buy and sell orders have accumulated in this range over several months. Such zones often attract price action.
Ethereum price has already moved closer to this band. Overhead liquidity remains relatively thin. This imbalance limits upside momentum for now. Until liquidity conditions change, downside pressure may persist.
 Source: CoinGlass
Momentum Indicators Remain Bearish
Daily momentum indicators continue to favor sellers. On-Balance Volume has made fresh lows. This signals ongoing distribution. The Directional Movement Index confirms a strong downtrend.
The daily RSI is nearing oversold territory. This reflects selling exhaustion rather than strength. Oversold readings can persist during strong downtrends. Traders remain cautious.
Trading Outlook and Risk Signals
Swing traders are watching the $2,000 to $2,200 range closely. Signs of strong buying interest are needed before long entries become attractive. Catching falling prices carries elevated risk.
A decisive break below $2,000 would be a warning signal. Such a move could indicate weak buyer demand. In that scenario, a deeper decline toward $1,300 becomes more likely.
Conclusion
Ethereum price is being pressured lower amid weekend capitulation. Short-term momentum favors bears. Futures liquidations and a poor sentiment persistently drag down the price action.
But the weekly still looks bullish and institutional accumulation is continuing. The $2,100 area is now a make-or-break level. How Ethereum price responds there could help define the next big move.
Also Read: Ethereum Staking Expands as Corporate Treasuries Lock Up 5.5% of ETH
Appendix: Glossary of Key Terms
Fear and Greed Index: A sentiment gauge that measures the greed level of investors in the crypto market.
Futures Liquidation: The forced closing out of a leveraged trading position as a result of margin inadequacy and the trigger thereof.
Liquidity Zone: A region of prices that holds significant buy or sell orders.
Weekly Swing Structure: A long-term chart pattern used to determine the direction of a trend.
Fibonacci Retracement: A technical analysis tool used to identify areas of potential support/resistance.
On-Balance Volume (OBV): A volume indicator that tells you when volume is flowing in and out of the stock.
RSI: A momentum indicator that indicates overbought or oversold conditions.
Frequently Asked Questions About Ethereum Price
1- Why did Ethereum price fall sharply?
Ethereum price dropped due to broad market weakness, heavy liquidations, and extreme fear-driven trading.
2- Is the long-term trend for Ethereum price still bullish?
Yes. The weekly structure remains bullish unless price closes below major long-term support.
3- What is the key support for Ethereum price now?
The $2,100–$2,200 zone is the main area traders are watching.
4- Can Ethereum price fall further?
A break below $2,000 would increase the risk of a deeper move toward lower levels.
References
AMBCrypto
CoinPaper
Read More: Why Ethereum’s $2.2K Level Could Decide the Next Bull Run">Why Ethereum’s $2.2K Level Could Decide the Next Bull Run


You May Also Like

Not a loophole: Singapore AI export controls let China tap US AI legally

Q2 Market Insights: Bitcoin regains dominance in risk-averse environment, ETFs remain critical to market structure

Iran’s army chief warns of ‘total destruction’ for ground invasion


