

Ethereum value under pressure: exhausted sellers or start of a deeper leg down?

Crypto markets are in a broadly risk-off phase, and that backdrop is weighing heavily on Ethereum value despite its strong underlying ecosystem.
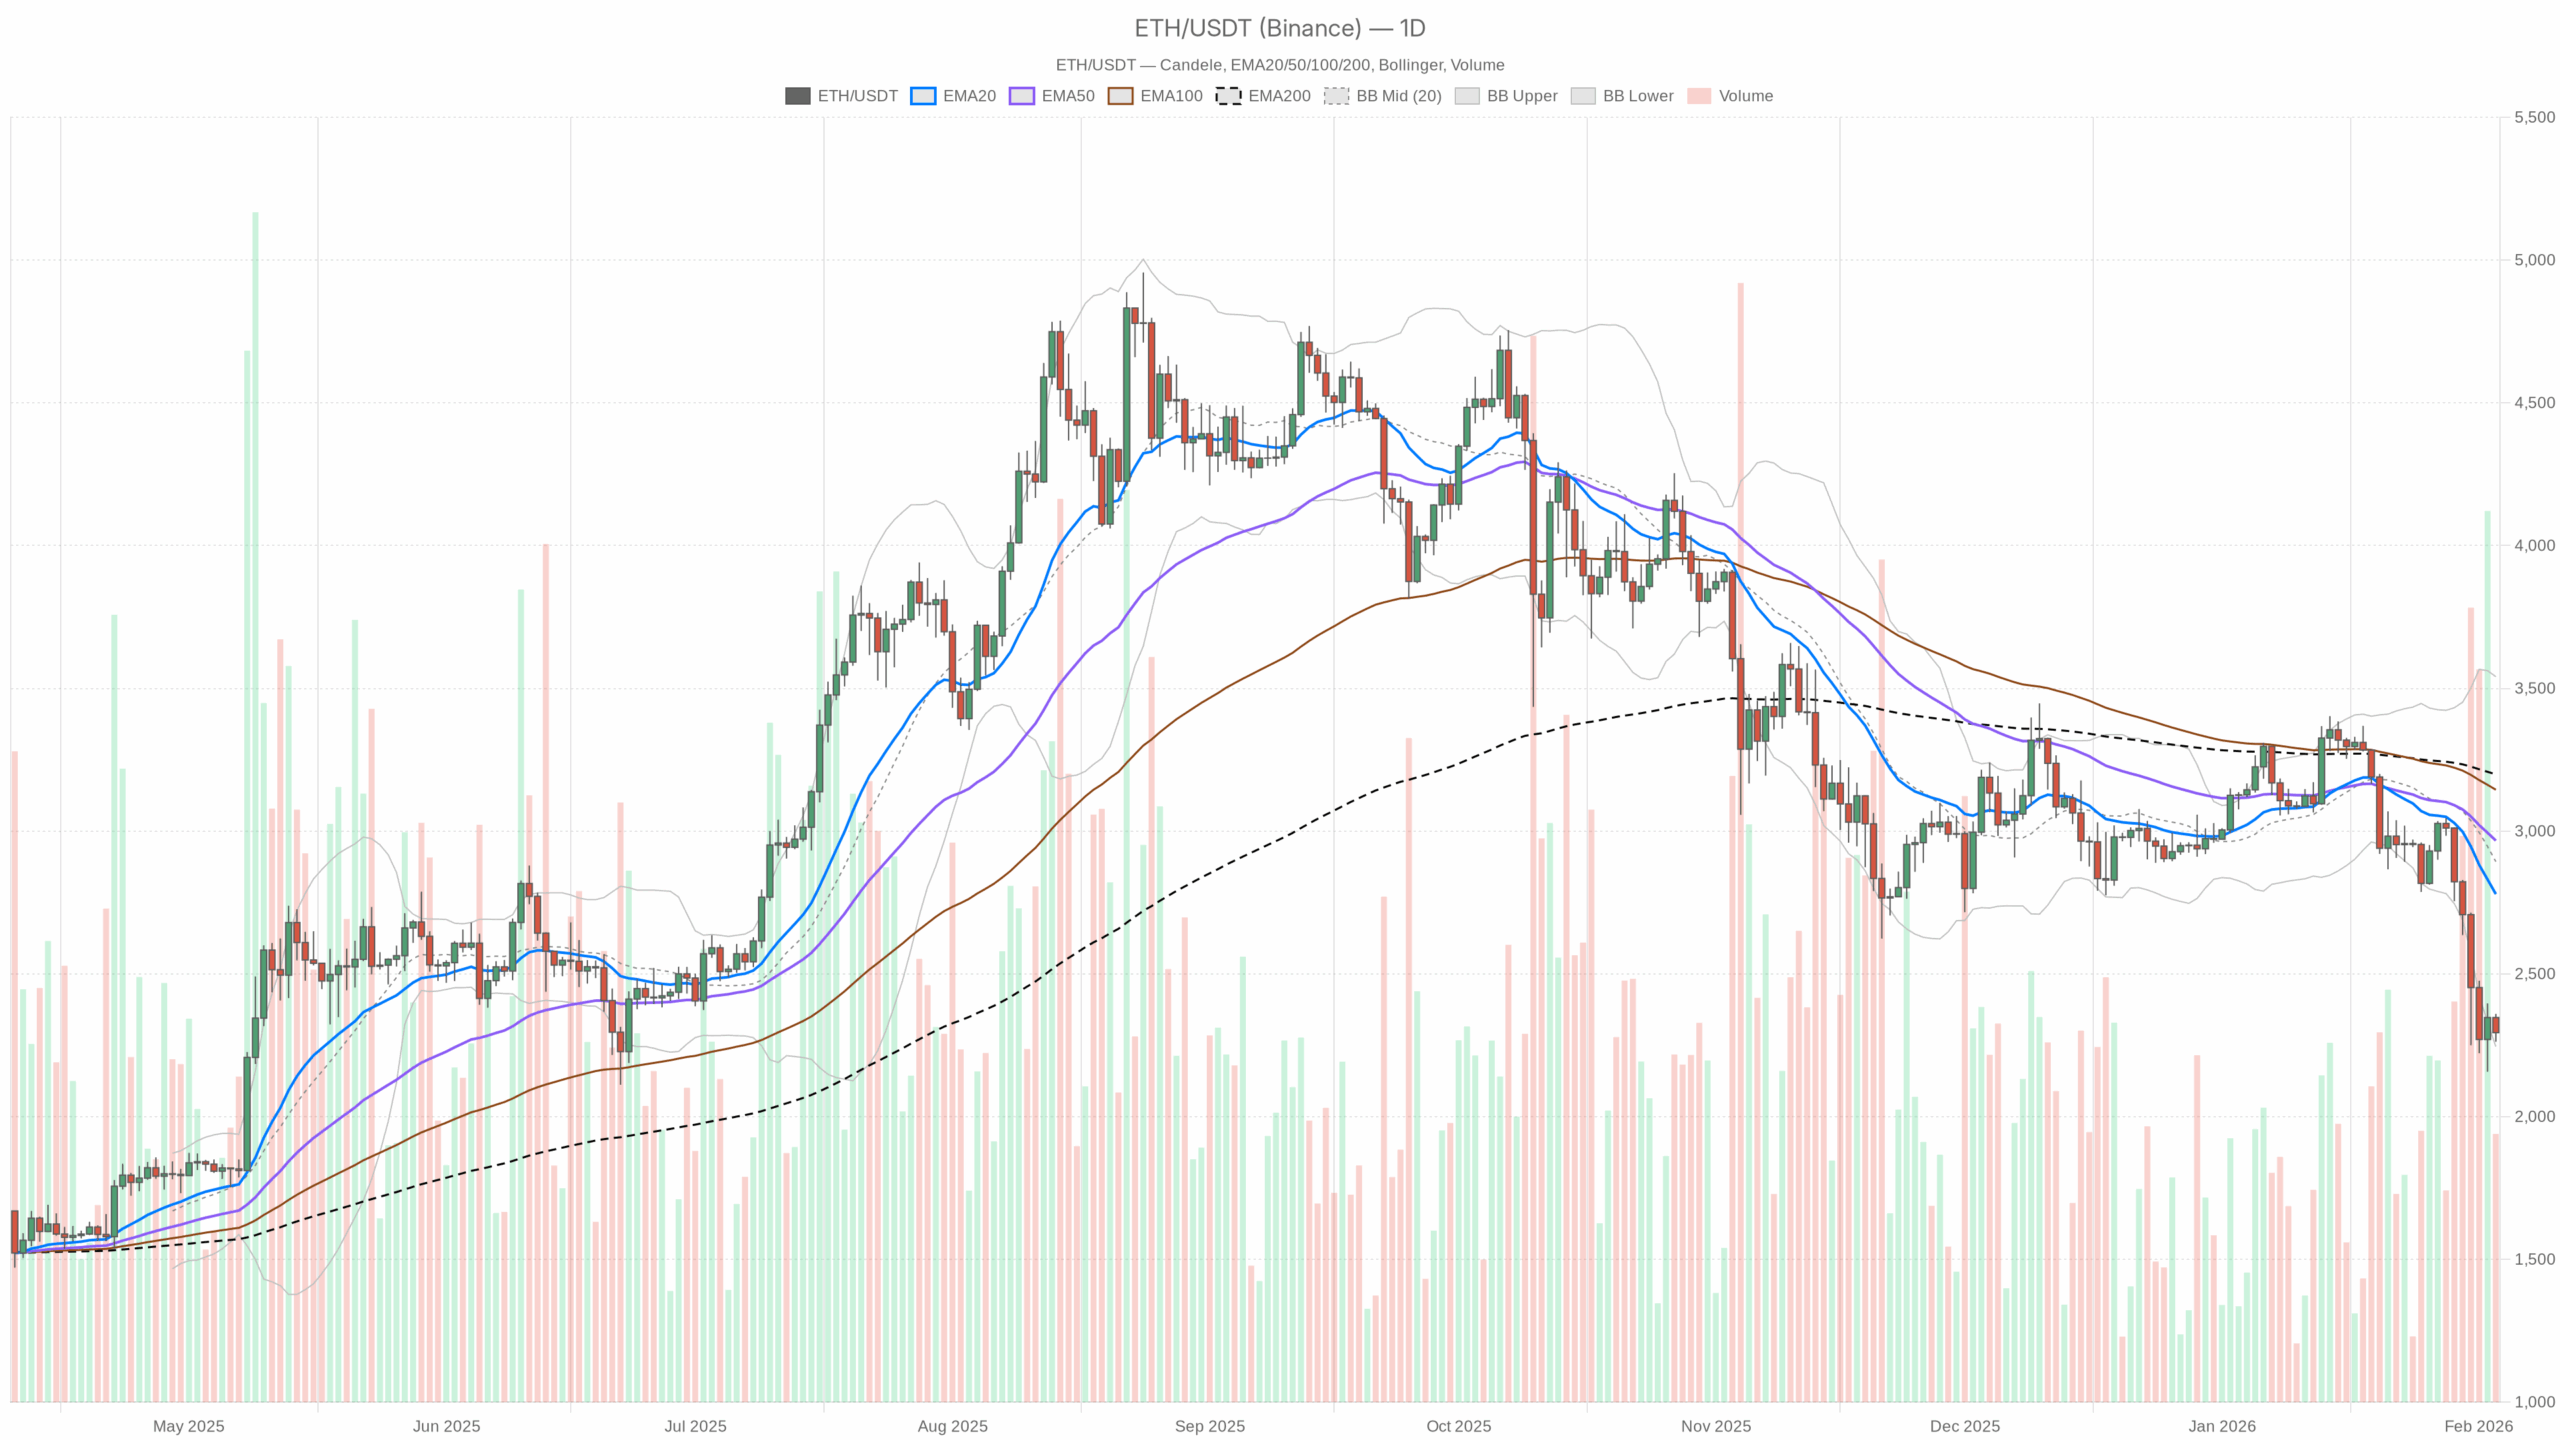 ETH/USDT daily chart with EMA20, EMA50 and volume”
loading=”lazy” />ETH/USDT — daily chart with candlesticks, EMA20/EMA50 and volume.
Main scenario from the daily chart: still bearish, with early signs of potential exhaustion
Ethereum is trading around $2,300 against USDT, deep below its recent range and firmly under all key daily moving averages. The broader environment is risk-off: Bitcoin dominance is near 58%, total crypto cap is flat, and the Fear & Greed Index sits at 17 – Extreme Fear. Capital is hiding in Bitcoin and stablecoins, not in Ethereum, and that context matters for any short- to medium-term view.
The dominant force at this moment is forced de-risking and trend following rather than hopeful dip buying. On the daily chart, ETH looks oversold but not yet reclaimed by buyers. That puts us in a classic tension: the trend is clearly down, but the degree of pessimism is already elevated. When Ethereum trades this far below its moving averages with an RSI in the mid-20s, you are usually either late in a selloff or early in a full breakdown. The next sessions will decide which one.
Based purely on the daily timeframe, the main scenario is bearish. Price is below the 20, 50 and 200-day EMAs, the MACD is deeply negative and widening, and ETH is hugging the lower Bollinger Band. This is a downtrend, not just a noisy pullback.
However, the combination of an RSI around 26 and daily price flirting with the lower Bollinger Band means new shorts are no longer getting attractive, low-risk entries. For traders, that usually shifts focus from chasing the move to selling bounces or waiting for a clearer base.
Daily chart (D1): Ethereum’s value in a mature downtrend
Trend structure – EMAs
Daily close: $2,294.04
EMA 20: $2,779.41
EMA 50: $2,966.70
EMA 200: $3,198.66
Price is sitting roughly $480–900 below the main EMAs. That tells us three things:
First, the downtrend is well established. ETH has lost its short-term and medium-term trend and is now trading far under its long-term trend as well. The curve of the EMAs will be pointing down or starting to flatten, which attracts systematic trend followers on the short side.
Second, the distance from the EMAs is now wide enough that immediate continuation lower becomes harder without some kind of pause or bounce. Markets rarely stay this stretched forever; they oscillate around these averages. That is not a buy signal by itself, but it does warn late sellers they are entering after a big move.
Third, for the bullish side to have any real credibility again, Ethereum needs to start reclaiming these EMAs from the bottom up, starting with the 20-day near $2,780. Until price is consistently closing back above that level, the EMAs are acting as a ceiling on the current market.
Momentum and exhaustion – RSI
Daily RSI 14: 26.45
RSI in the mid-20s shows strong downside momentum but also moves the market into oversold territory. In practice:
- Sellers have been in control for days; this is not a marginal dip.
- The risk of an oversold snapback or at least a sideways consolidation is increasing.
- The quality of new short entries is deteriorating; bears now rely on continuation rather than timing.
If RSI stabilizes and curls up from here while price holds or slightly undercuts current levels, that would hint that the worst of the momentum selling is behind us, even if the trend remains down.
Trend strength and follow-through – MACD
Daily MACD line: -191.14
Daily signal line: -110.41
Daily histogram: -80.73
The MACD is deeply negative and the histogram is still meaningfully below zero. That tells us the downtrend is active and not yet convincingly slowing. The bears have had enough time to build positions, and the selling is not just a one-day flush.
For a tactical bull case, traders would want to see the histogram moving back toward zero, with shrinking negative bars, while price stops making new lows. Right now, the market is not there yet; the MACD validates the bearish main scenario on the daily chart.
Volatility and extremes – Bollinger Bands
Daily BB mid (20 SMA): $2,893.07
Upper band: $3,540.86
Lower band: $2,245.29
Daily close: $2,294.04 (just above the lower band)
Ethereum is trading right near the lower Bollinger Band. That is typical behavior late in a selloff: price rides the band on the way down. Being this close to the lower band means:
- The market has already priced in a big chunk of the recent negative flow.
- Short term, ETH is near the bottom of the current volatility envelope.
- A sideways range or a bounce toward the mid-band around $2,900 becomes more probable over time, even inside a broader downtrend.
However, hugging the band with no clear intraday rejection means traders must still respect the possibility of a band expansion lower if fresh bad news or broader risk-off selling hits.
Volatility and risk – ATR
Daily ATR 14: $178.98
An average daily range near $180 is sizeable relative to a $2,300 price. That is a volatility regime where normal daily swings of 6–8% are on the table. For positioning, it means:
- Stops and position sizing must assume wide, noisy intraday moves.
- Breakouts and breakdowns can overshoot levels before mean-reverting.
- Short-term pricing is more fragile: a few candles can move ETH several hundred dollars either way.
Short-term reference: daily pivot levels
Daily Pivot Point (PP): $2,305.36
R1: $2,348.56
S1: $2,250.83
ETH is trading just below the daily pivot around $2,305, with price roughly midway between R1 and S1. That is consistent with a market that is weak but not in the middle of a fresh breakdown at this very moment. The pivot cluster in the $2,250–2,350 area defines today’s battleground for short-term traders.
Holding above S1 keeps the door open for intraday bounces; losing S1 with momentum would put the lower Bollinger Band under real pressure and could accelerate the move to the downside.
1-hour chart (H1): bears still in charge, but pressure is easing
On the hourly timeframe, the downtrend is still present, but the selling is more orderly and less aggressive than on the daily chart.
H1 close: $2,301.48
EMA 20: $2,313.12
EMA 50: $2,346.27
EMA 200: $2,600.06
RSI 14: 45.98
MACD line: -8.96, signal: -4.94, hist: -4.02
BB mid: $2,323.25, upper: $2,371.52, lower: $2,274.98
ATR 14: $30.76
Pivot PP: $2,301.11
Price is hugging the H1 pivot, slightly below the 20 and 50-hour EMAs and far below the 200-hour EMA. That describes a short-term bearish bias, but with RSI near 46 and a modestly negative MACD, the immediate selling pressure is more controlled than on the daily timeframe.
In plain terms, the H1 chart says the trend is still down, but the market is catching its breath. If bulls can reclaim the 50-hour EMA around $2,345 and hold above it, the hourly structure would start to undermine the strong daily bear case. For now, it is more of a weak drift than a new impulsive leg.
15-minute chart (M15): neutral and choppy – execution, not direction
M15 close: $2,301.37
EMA 20: $2,295.69
EMA 50: $2,308.37
EMA 200: $2,341.84
RSI 14: 51.14
MACD line: -6.13, signal: -9.37, hist: +3.24
BB mid: $2,292.76, upper: $2,324.37, lower: $2,261.15
ATR 14: $11.60
Pivot PP: $2,301.07
The M15 regime is neutral. RSI around 51 and a tiny positive MACD histogram point to a short-term balance between buyers and sellers. Price is oscillating around the 20 and 50-period EMAs and the intraday pivot, with no clear dominance.
For traders, this timeframe is about execution rather than bias: buying dips into support or fading spikes into resistance within the broader daily downtrend. It does not negate the larger bear trend; it simply shows that, right now, neither side is in full control minute by minute.
Market context: value under pressure, with fear elevated
Ethereum’s share of total crypto market cap is about 10.2%, while Bitcoin sits near 57.6%. That is a classic phase where the market values liquidity and perceived safety over smart contract beta. Extreme Fear on the sentiment index lines up with what appears on the ETH chart: heavy pressure, but also the beginnings of potential exhaustion.
DeFi activity on platforms such as Uniswap and Curve still shows robust fee generation, with sizeable month-on-month growth in several DEXs. The underlying Ethereum economy is not dead; what is repricing here is risk appetite, not fundamental utility. That distinction matters when thinking about medium-term Ethereum value: structural demand remains, but the market does not want to pay previous multiples for that risk right now.
Scenarios for Ethereum value
Bullish scenario: oversold bounce and mean reversion
In the bullish case, the current extreme fear and oversold daily RSI mark a late stage of the selloff. Price would stabilize above the lower Bollinger Band and start to print higher lows on the hourly chart.
Key steps for this scenario:
- Hold above $2,250 (daily S1 and near lower BB). A defense of this zone signals sellers are losing the ability to push price cleanly lower.
- H1 reclaim of the 50-EMA around $2,345 and then a move toward the mid-Bollinger on H1. That would shift the hourly from controlled bleed to early recovery.
- On the daily chart, a bounce toward the BB mid and EMA 20 around $2,780–2,900. That is the natural mean reversion target once a bottoming pattern takes hold.
Under this script, Ethereum value recovers a few hundred dollars in a relief move, catching offside shorts and calming sentiment, but still within a broader corrective structure.
This bullish scenario is invalidated if ETH loses the $2,250 area with strong volume and closes a daily candle decisively below the lower Bollinger Band, or if RSI stays pinned in the low 20s while price trends lower for several more sessions. That would indicate the market is not in exhaustion yet, but in the middle of a stronger down leg.
Bearish scenario: continuation and trend acceleration
In the bearish case, the daily trend simply keeps grinding lower. The market treats any small intraday bounce as a selling opportunity, and the H1 and M15 charts roll over again in line with the daily structure.
Key steps for this scenario:
- Failure to hold above the daily pivot and S1. If ETH starts spending time below $2,250 and cannot reclaim $2,300 on rebounds, it shows demand is thinning out.
- MACD stays deeply negative on the daily while the histogram avoids meaningful contraction, confirming ongoing trend strength.
- The lower Bollinger Band begins to expand downward, signaling that volatility is breaking to the downside, not just stretching and snapping back.
Under this script, Ethereum’s value slides into a new range lower, with $2,300 turning from a floor into a ceiling. Sellers stay in control, and the market may begin to discuss the next big support levels well below current prices.
This bearish scenario is invalidated if ETH reclaims and holds above the 20-day EMA (around $2,780) with improving daily RSI and a MACD histogram that starts rising toward zero. That would mark a clear shift in the balance of power away from trend sellers and toward dip buyers.
How to think about positioning around Ethereum’s value now
Across timeframes, the message is consistent: the dominant trend is down, but the market is entering an oversold, high-volatility zone. Daily charts still reward respecting the bearish bias; intraday charts warn that chasing at current levels is less attractive than it was a few hundred dollars higher.
For anyone active in this environment, risk management matters more than nailing the exact bottom or top. ATR levels show that ETH can easily swing $150–200 in a day, which means both sides can be punished quickly if they oversize or lean too hard into a binary view.
The long-term story for Ethereum is being repriced, not erased. Right now, the market is paying less for that story because macro risk appetite is weak and Bitcoin is soaking up most of the capital. Whether this zone becomes an attractive area or just a waypoint on the way down will be decided by how price behaves around the $2,250–2,350 range and whether bulls can drag ETH back toward its daily averages in the coming weeks.
If you want to monitor markets with professional charting tools and real-time data, you can open an account on Investing using our partner link:
Open your Investing.com account
This section contains a sponsored affiliate link. We may earn a commission at no additional cost to you.
Disclaimer: This market commentary is for informational and educational purposes only. It reflects a technical and contextual view of current conditions and should not be considered investment, trading, or financial advice. Markets are volatile and unpredictable; always do your own research and assess your own risk tolerance before making any trading decisions.


You May Also Like

Watching Hyperliquid (HYPE) Candles From the Sidelines Sucks: BlockchainFX ($BFX) Is the Top Crypto to Buy Now

Is Capital Rotating? SHIB Investors Move to Utility Tokens


