

Solana Shows Mixed Signals as Selling Pressure Persists, But ETFs Attract Interest
- Solana faces strong selling pressure and is trading near $103.
- U.S.-listed spot Solana ETFs saw $5.58M inflows amid market weakness.
The majority of crypto assets saw a slight increase today following a severe market decline, but the fear and greed index of CoinMarketCap is around 17, which is an extreme fear condition, where traders are still cautious towards the crypto assets.
Amid the broader weakness, Solana, the seventh-largest crypto by market value, faced heavy selling pressure, as it reached a low of $95.87 before finding support yesterday.
In the last 24 hours, Solana is trading near $103, down about 0.23%, and is also down nearly 17% in a weekly chart. Even the Solana’s 24-hour trading volume is down with 47.95% and stands at $4.15 billion, at the time of writing.
Solana Shows Mixed Market Signals
As per the Coinglass derivatives data, Solana’s open interest rate is also showing a downtrend of around 2.78%, pointing to a reduction in leveraged positions. As it saw total liquidations of $9.12 million, long positions accounted for around $3.85 million, and short positions stood at $5.27 million, which points to unstable price action and a lack of clear direction from traders.
Meanwhile, U.S.-based Solana exchange ETFs saw inflows of $5.58 million on February 2, which breaks two days outflow streak and also breaks the weekly outflows of $ 2.45 million, as per the SoSoValue data. So, the return of inflows signals selective buying interest from institutional investors, where short-term traders remain cautious.
Solana Price Analysis
On seeing the one-day chart of Solana, the immediate support level is seen at $95.00; a break below $95, which might result in further declines, and pushes the price down to $80. On the upside, the first near-term resistance is identified at $105, and the next major resistance is seen at $124. With that, a significant break above that level could indicate a bullish trend.
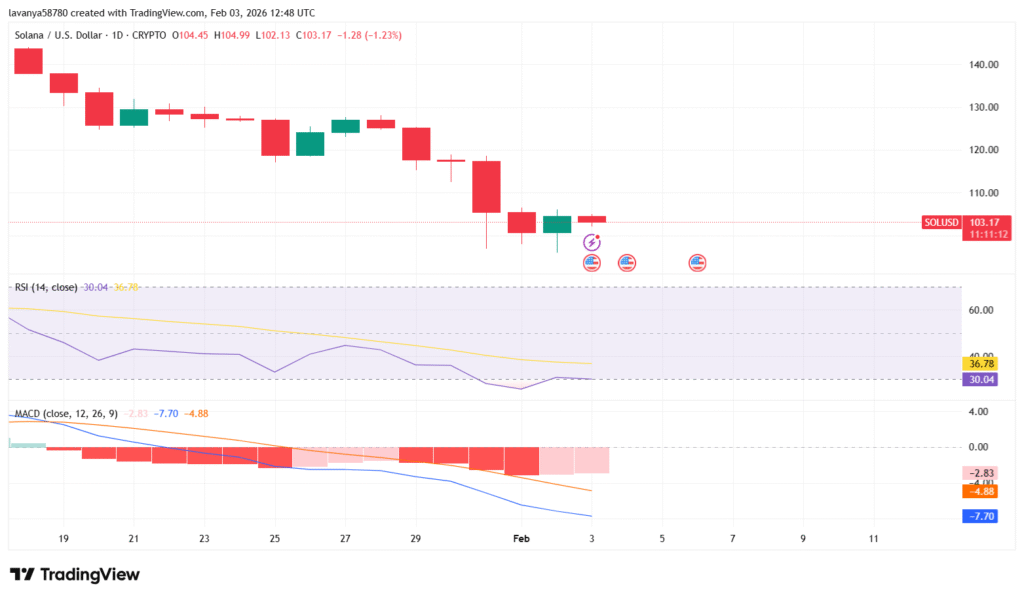 Source: TradingView
On seeing the indicators, the relative strength index (RSI) is sitting exactly at 30, which is approaching oversold levels, indicating weak momentum and suggesting potential buying interest if the trend reverses. Solana’s MACD line (Moving Average Convergence and Divergence) is moving below the signal line, which clearly signals that selling pressure is dominant and a bearish trend may persist in the short term.
Highlighted Crypto News Today:
JPMorgan Report Highlights Growing AI Appetite Among Family Offices Worldwide


You May Also Like

Leap Wallet to Shut Down by May 28 as Team Winds Down Apps and Validator

Crypto Sectors Reveal Striking Divergence: 5 Explosive Gainers and 5 Troubled Decliners in 2025


