Ethereum price fell toward $2,200 after another wave of selling, with rising volume and weak momentum keeping traders on the defensive. At the time of writing, Ethereum price fell toward $2,200 after another wave of selling, with rising volume and weak momentum keeping traders on the defensive. At the time of writing,

Ethereum price enters high-risk zone below $2.3K as network activity surges – further decline ahead?

3 min read

Ethereum price fell toward $2,200 after another wave of selling, with rising volume and weak momentum keeping traders on the defensive.

Summary
  • Ethereum continued to slide as traders reduced risk exposure.
  • Futures data showed rising activity but falling confidence.
  • Technical signals point to limited upside without a strong rebound.

At the time of writing, Ethereum was trading at $2,264, a 2.8% decline over the previous day, further sinking into a vulnerable range. This drop comes after a steep sell-off that has caused ETH to drop across all significant time periods. 

Ethereum (ETH) has fluctuated between $2,120 and $3,034 over the last week, but the trend has been decisively downward. In total, ETH has lost 24% in the past seven days and 28% over the last month, now sitting roughly 54% below its all-time high of $4,946 reached in August 2025.

Trading activity has increased as prices dropped. Ethereum recorded $47.25 billion in spot trading volume over the last 24 hours, up 21%.

Derivatives markets showed a similar pattern. CoinGlass data shows futures volume climbed 38% to $105 billion, while open interest slipped 1.18% to $27 billion. This suggests traders are trimming exposure rather than adding fresh leverage.

On-chain activity raises caution flags

On-chain data has drawn fresh attention. A Feb. 4 report from CryptoQuant contributor CryptoOnchain showed Ethereum’s transfer count, measured using a 14-day moving average, rising to about 1.17 million.

These kinds of spikes have often surfaced during times of increased market stress. Both Jan. 2018 and May 2021 saw similar spikes, which were followed by steep price drops.

While higher transaction counts can signal strong network use, sudden spikes are also linked to large-scale repositioning and distribution during uncertain market phases.

The current data does not confirm a market top. Still, it places Ethereum in a zone where downside risk has historically increased, especially when price momentum is already weak.

Ethereum price technical analysis

From a chart perspective, Ethereum remains locked in a daily downtrend. Lower highs and lower lows have continued to form since the price failed near the $4,000 region. No clear break in structure has yet been established.

Ethereum price enters high-risk zone below $2.3K as network activity surges – further decline ahead? - 1

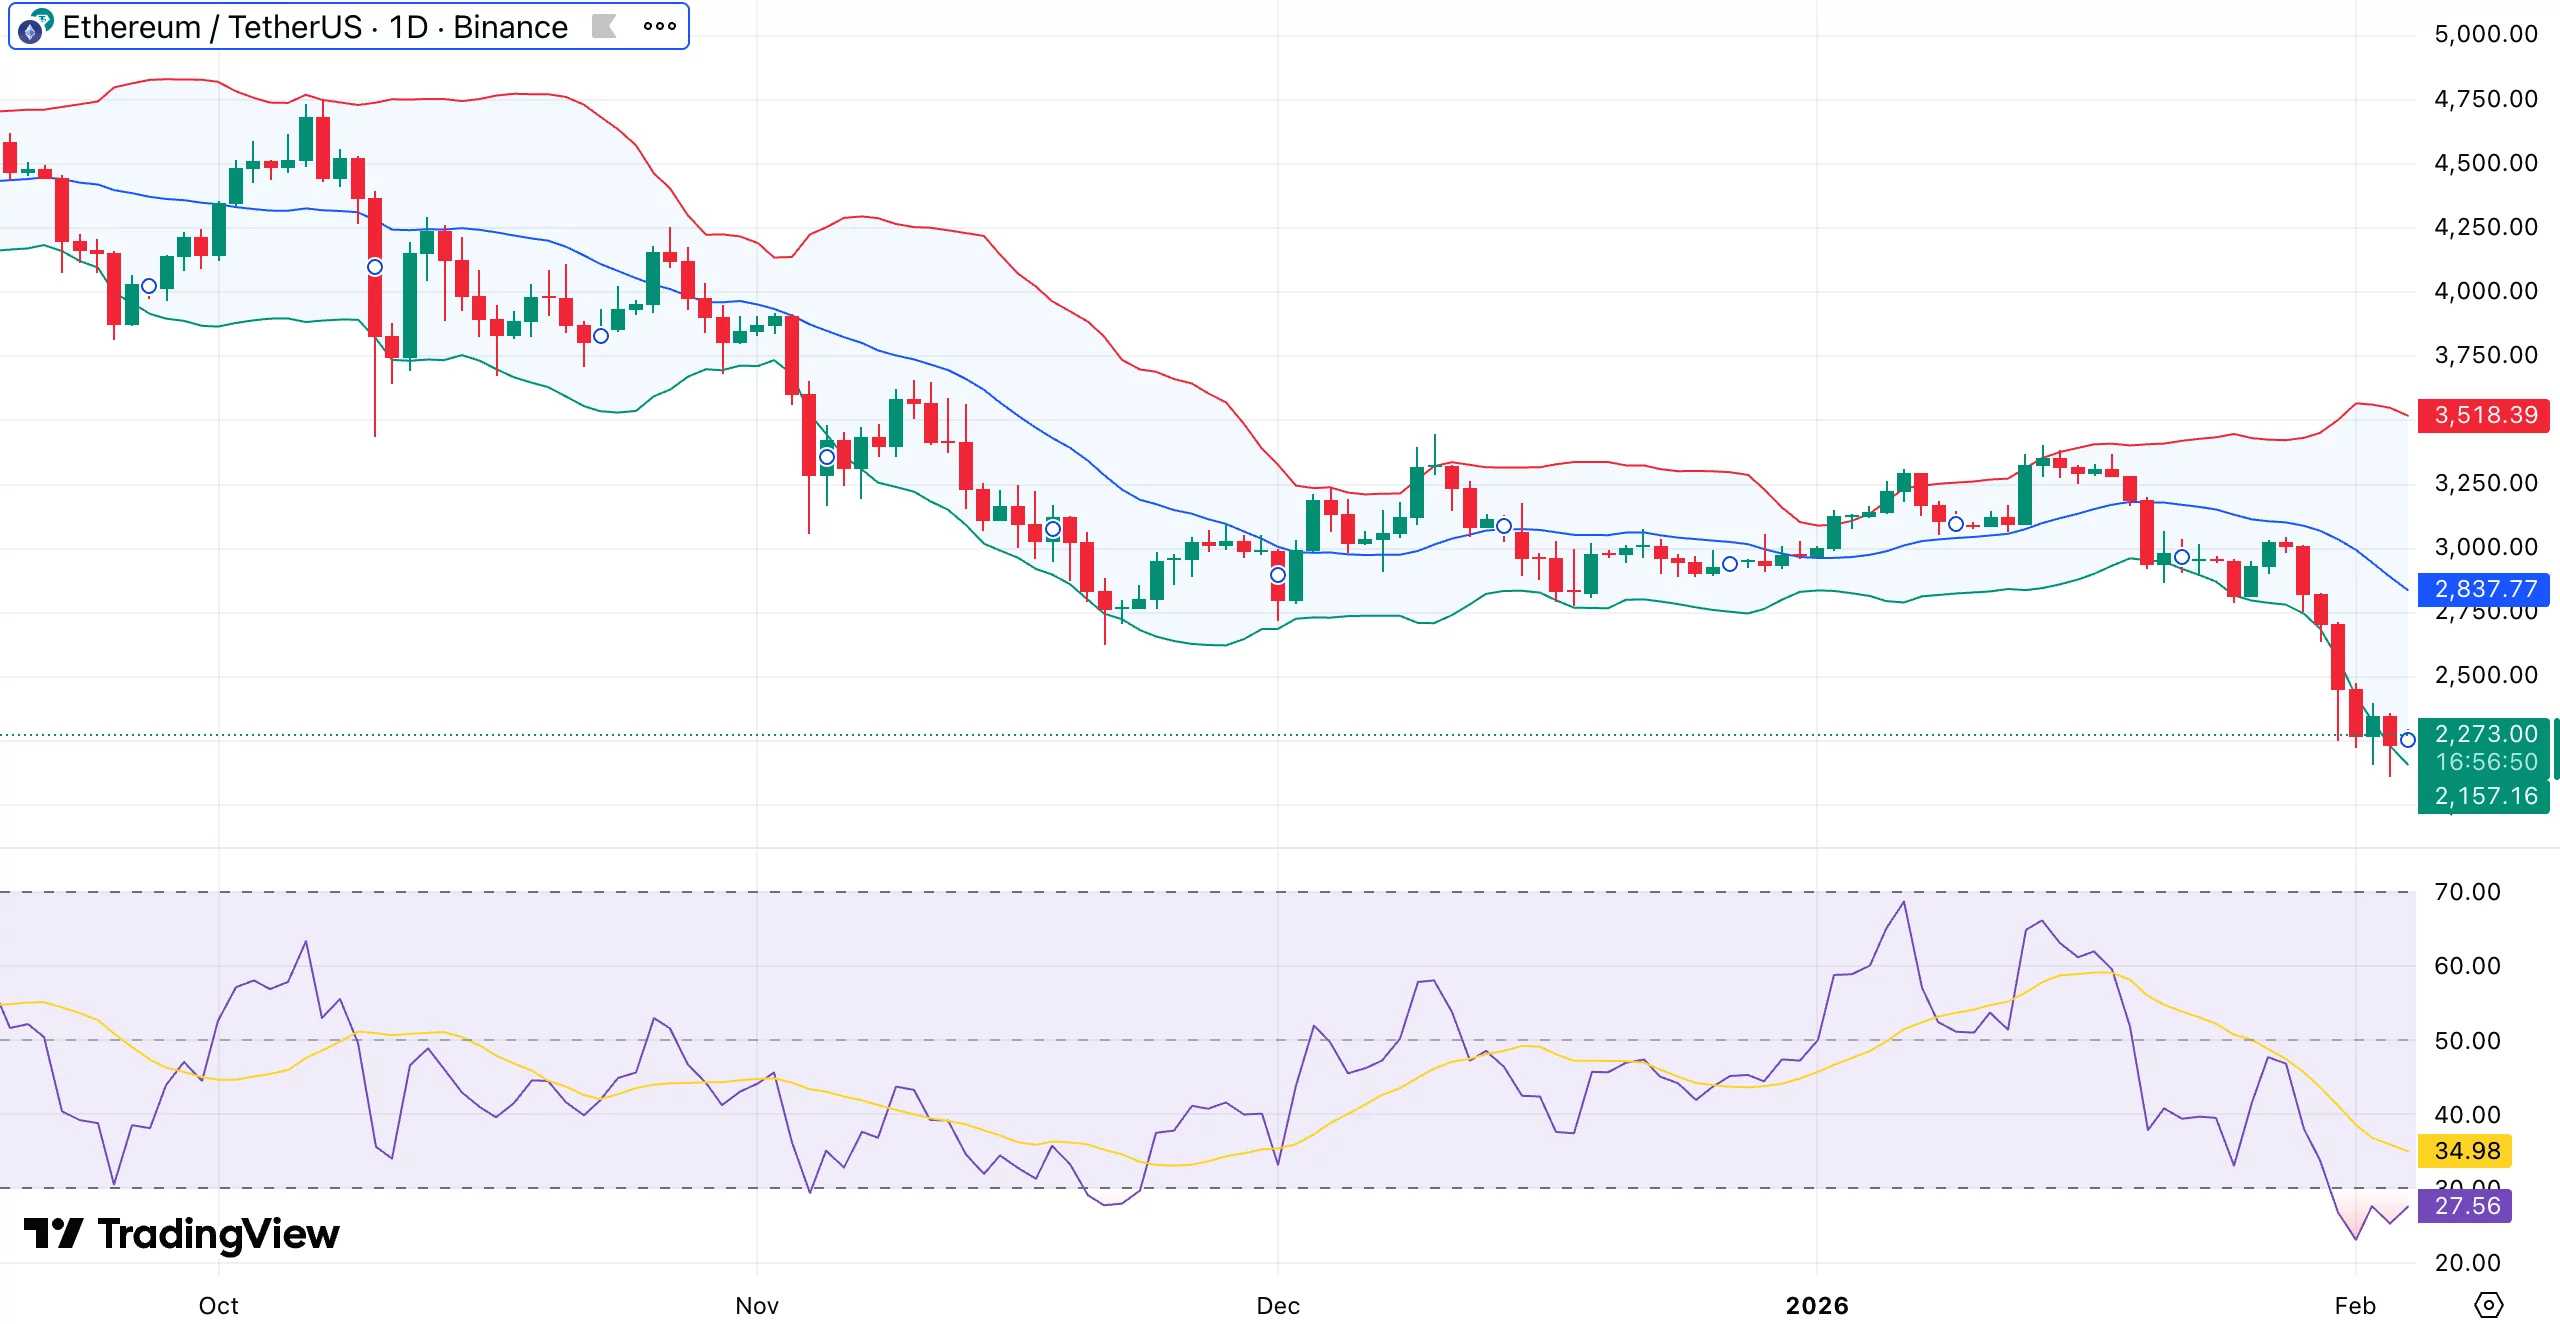
Repeated pullbacks from the mid-Bollinger Band have reinforced selling pressure. Every rebound attempt has so far run into resistance near the 20-day moving average, with upside momentum fading quickly after each move. This pattern suggests that sellers are still in charge of short-term price movement.

Additionally, Ethereum has fallen below the lower Bollinger Band, indicating an increase in downside volatility. Rather than marking exhaustion, the move suggests that selling pressure is still active within the broader downtrend.

The loss of the $3,000 level has further weakened the structure. Although the price briefly returned above the zone, ETH was unable to hold, and the zone flipped into resistance. Momentum is still muted with the daily relative strength index in the low 30s and minimal signs of a long-term recovery.

A modest recovery could develop if selling slows and price holds above the $2,150–$2,200 area.  However, a more meaningful shift in sentiment would require ETH to reclaim $2,300 and move toward the $2,700–$2,800 range. Without a daily close above those levels, upside attempts are likely to remain shallow and short-lived.

Disclaimer: The articles reposted on this site are sourced from public platforms and are provided for informational purposes only. They do not necessarily reflect the views of MEXC. All rights remain with the original authors. If you believe any content infringes on third-party rights, please contact [email protected] for removal. MEXC makes no guarantees regarding the accuracy, completeness, or timeliness of the content and is not responsible for any actions taken based on the information provided. The content does not constitute financial, legal, or other professional advice, nor should it be considered a recommendation or endorsement by MEXC.

You May Also Like

Michael Saylor’s Strategy follows Metaplanet, adding 6,269 BTC worth $729 million

Michael Saylor’s Strategy follows Metaplanet, adding 6,269 BTC worth $729 million

The post Michael Saylor’s Strategy follows Metaplanet, adding 6,269 BTC worth $729 million appeared on BitcoinEthereumNews.com. The two giant BTC holders, Strategy and Metaplanet, have stirred the waters despite the FUD in the Bitcoin market by acquiring a total of 6,269 Bitcoins. According to reports, Strategy has acquired 850 BTC while Metaplanet has acquired a bumper 5,419 tokens. Michael Saylor’s Strategy, the world’s largest corporate Bitcoin holder, purchased BTC worth $99.7 million at $117,344 per Bitcoin. This has brought its total Bitcoin holdings to 639,835 BTC, acquired for about $47.3 billion at $73,971 per Bitcoin. JUST IN: Strategy buys 850 BTC for $99.7M at $117,344 per BTC. Now holds 639,835 $BTCTotal spent: $47.33B Avg cost: $73,971 per BTCYTD BTC yield: 26.0% https://t.co/7iv2difHzR pic.twitter.com/O8WfDpJDxQ — Cryptopolitan (@CPOfficialtx) September 22, 2025 On the other hand, as reported by Cryptopolitan, Metaplanet purchased BTC worth $632.53 million at an average price of roughly $116,724 per Bitcoin. This has brought its total BTC holdings to 25,555 BTC, which was acquired for approximately $2.7 billion and purchased at an average price of $106,065 per BTC. Strategy slows down BTC purchase while Metaplanet adds speed The US company’s most recent Bitcoin purchase is in line with a recent trend of small purchases, showing a slowdown compared to the big purchases seen earlier this year. Strategy bought 3330 Bitcoin in September, which is a big drop from the 7,714 BTC it bought in August and a 75% drop from the 31,466 BTC it bought in July. In line with Bitcoin, Strategy’s stock has dropped about 2% in the last 30 days. Starting in 2020, the company put most of its money into Bitcoin. It used a mix of debt and stock to buy huge amounts of BTC, which turned the business intelligence software company into a Bitcoin giant. Still, the stock has gone up 2,200% since it started buying BTC. On the other hand,…
Share
BitcoinEthereumNews2025/09/22 22:54
Payward Revenue Hits $2.2 Billion as Kraken Exchange Reports Strong 2025 Growth

Payward Revenue Hits $2.2 Billion as Kraken Exchange Reports Strong 2025 Growth

TLDR Payward, Kraken’s parent company, earned $2.2 billion in 2025, a 33% increase from 2024’s $1.6 billion Trading revenue and asset-based services each contributed
Share
Blockonomi2026/02/04 20:11
Super Micro Computer (SMCI) Stock: Revenue Soars Past $12B on AI Server Boom

Super Micro Computer (SMCI) Stock: Revenue Soars Past $12B on AI Server Boom

TLDR Revenue hit $12.7 billion, crushing $10.42 billion estimate and up 123.4% year-over-year EPS of $0.69 beat consensus $0.49 by 40.8% in fiscal Q2 Q3 guidance
Share
Blockonomi2026/02/04 20:36