The rejection of HYPE did not come from a sudden selloff, but from what followed the bounce. After pushing higher in early February, HYPE stalled exactly where The rejection of HYPE did not come from a sudden selloff, but from what followed the bounce. After pushing higher in early February, HYPE stalled exactly where

HYPE Fails to Reclaim Resistance as Momentum Fades: What’s Next?

2026/02/04 22:59
3 min read
For feedback or concerns regarding this content, please contact us at [email protected]

The rejection of HYPE did not come from a sudden selloff, but from what followed the bounce.

After pushing higher in early February, HYPE stalled exactly where prior recoveries had failed, leaving price rotating below a declining resistance instead of building continuation.

That behavior matters more than the move itself. It signals that upside attempts are being absorbed rather than extended.

At the time of observation, HYPE is trading around $33.5, holding above local support but still structurally capped.

Short-Term Price Action: Failed Reclaim Keeps Pressure Intact

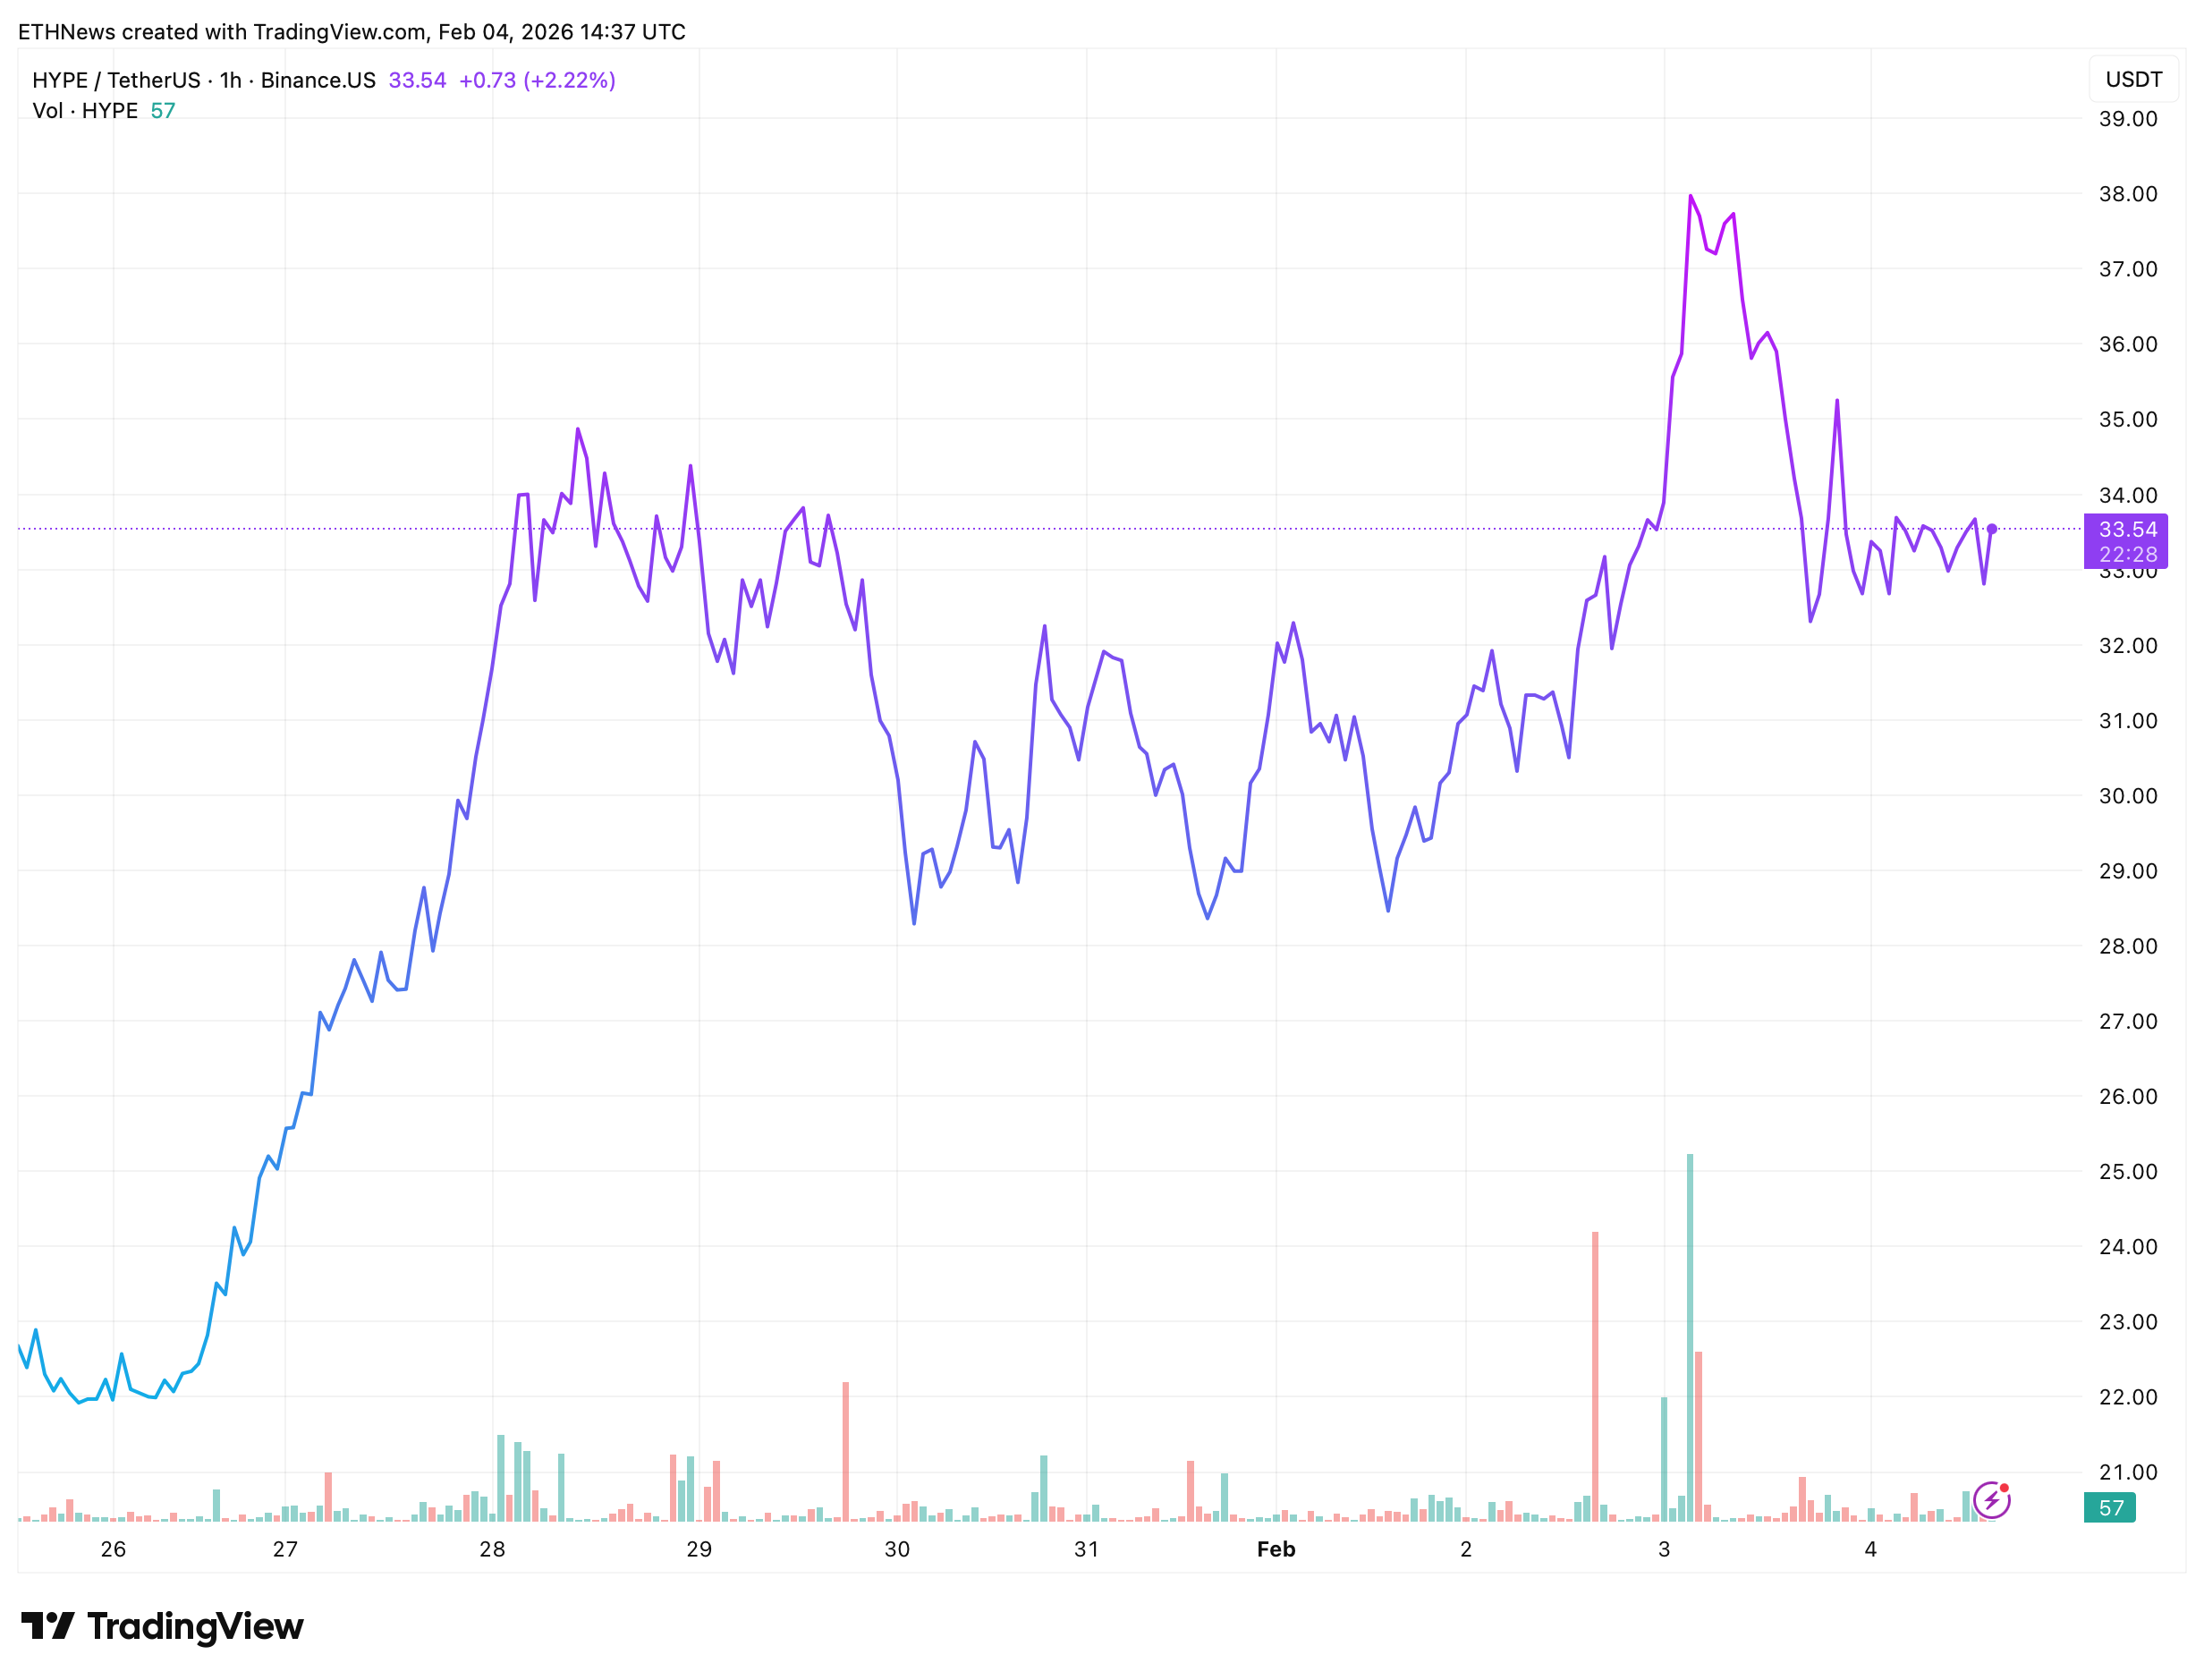
On the chart, price surged from the $28–$30 region into the mid-$30s before stalling. The advance was sharp, but follow-through weakened quickly once price reached the $35–$38 area, where sellers stepped back in.

Source: https://t.me/gainmuse/1759

Current price is hovering near $33.54, consolidating after the rejection. Volume expanded during the initial push higher but failed to remain elevated during subsequent attempts, suggesting reactive buying rather than sustained demand.

Immediate support is defined near $32–$33. This zone has been tested multiple times and continues to hold for now. Below it, the next support area sits closer to $30–$31, where the prior base formed before the latest bounce.

On the upside, resistance remains firm in the $35–$36 range. As long as price stays capped beneath this level, upside attempts lack confirmation and remain corrective in nature.

Higher-Timeframe Structure: Compression Under Descending Resistance

The broader structure, highlighted in the annotated chart by crypto trader GainMuse, shows HYPE trading beneath a clearly defined descending resistance line. Multiple recovery attempts over recent weeks have failed at progressively lower levels, reinforcing the bearish structure.

Price is currently compressing between that declining resistance and a rising short-term support line. This type of compression typically resolves with expansion, but the direction depends on which side gains acceptance first.

Importantly, the latest bounce did not result in acceptance above resistance. Instead, price rolled over back into the range, keeping the dominant structure intact and leaving momentum tilted to the downside.

This alignment shows short-term stabilization occurring within a broader structure that still favors sellers.

Euro Stablecoin Market Poised for 1,600x Explosion by 2030, S&P Global Predicts

Compression Near a Decision Point

On the constructive side, holding above $32 keeps price within the current compression range and allows for another test of resistance near $35–$36. A sustained acceptance above that zone would be required to shift structure and open the door for a move toward the upper resistance area visible near $38.

Risk remains clearly defined. A decisive break below $32 would invalidate the compression and increase the probability of continuation toward the $30–$31 support zone. Failure there would further reinforce the bearish structure.

This remains a conditional environment. Direction will be determined by acceptance, not by intraday spikes.

Market Takeaway

HYPE is no longer accelerating higher, but it has not reclaimed control either. Price is consolidating around $33.5, trapped beneath descending resistance after another failed recovery attempt.

For now, structure remains heavy. Upside scenarios depend on acceptance above resistance, while a loss of support would quickly shift risk back toward continuation lower. The market is compressing, and resolution will depend on which side proves willing to commit first.

The post HYPE Fails to Reclaim Resistance as Momentum Fades: What’s Next? appeared first on ETHNews.

Market Opportunity
Hyperliquid Logo
Hyperliquid Price(HYPE)
$35.65
$35.65$35.65
+2.20%
USD
Hyperliquid (HYPE) Live Price Chart
Disclaimer: The articles reposted on this site are sourced from public platforms and are provided for informational purposes only. They do not necessarily reflect the views of MEXC. All rights remain with the original authors. If you believe any content infringes on third-party rights, please contact [email protected] for removal. MEXC makes no guarantees regarding the accuracy, completeness, or timeliness of the content and is not responsible for any actions taken based on the information provided. The content does not constitute financial, legal, or other professional advice, nor should it be considered a recommendation or endorsement by MEXC.
Tags:

You May Also Like

Today’s Biggest Crypto Movers: Dogecoin Leads the Pack

Today’s Biggest Crypto Movers: Dogecoin Leads the Pack

Today's Biggest Crypto Movers: Dogecoin Leads the Pack 🚀 Crypto Markets Heat Up Today Major cryptocurrencies are showing strong gains. Let's dive into today's top
Share
Blockchainmagazine2026/04/03 13:00
RWA Boom Accelerates As Tokenized Assets Hit New Highs In Early 2026

RWA Boom Accelerates As Tokenized Assets Hit New Highs In Early 2026

RWA distributed value rose from about $21B to $27.5B in Q1 2026, a gain of roughly 30%. Tokenized US Treasuries reached about $10B, creating an on-chain yield base
Share
LiveBitcoinNews2026/04/03 13:00
Cryptos Signal Divergence Ahead of Fed Rate Decision

Cryptos Signal Divergence Ahead of Fed Rate Decision

The post Cryptos Signal Divergence Ahead of Fed Rate Decision appeared on BitcoinEthereumNews.com. Crypto assets send conflicting signals ahead of the Federal Reserve’s September rate decision. On-chain data reveals a clear decrease in Bitcoin and Ethereum flowing into centralized exchanges, but a sharp increase in altcoin inflows. The findings come from a Tuesday report by CryptoQuant, an on-chain data platform. The firm’s data shows a stark divergence in coin volume, which has been observed in movements onto centralized exchanges over the past few weeks. Bitcoin and Ethereum Inflows Drop to Multi-Month Lows Sponsored Sponsored Bitcoin has seen a dramatic drop in exchange inflows, with the 7-day moving average plummeting to 25,000 BTC, its lowest level in over a year. The average deposit per transaction has fallen to 0.57 BTC as of September. This suggests that smaller retail investors, rather than large-scale whales, are responsible for the recent cash-outs. Ethereum is showing a similar trend, with its daily exchange inflows decreasing to a two-month low. CryptoQuant reported that the 7-day moving average for ETH deposits on exchanges is around 783,000 ETH, the lowest in two months. Other Altcoins See Renewed Selling Pressure In contrast, other altcoin deposit activity on exchanges has surged. The number of altcoin deposit transactions on centralized exchanges was quite steady in May and June of this year, maintaining a 7-day moving average of about 20,000 to 30,000. Recently, however, that figure has jumped to 55,000 transactions. Altcoins: Exchange Inflow Transaction Count. Source: CryptoQuant CryptoQuant projects that altcoins, given their increased inflow activity, could face relatively higher selling pressure compared to BTC and ETH. Meanwhile, the balance of stablecoins on exchanges—a key indicator of potential buying pressure—has increased significantly. The report notes that the exchange USDT balance, around $273 million in April, grew to $379 million by August 31, marking a new yearly high. CryptoQuant interprets this surge as a reflection of…
Share
BitcoinEthereumNews2025/09/18 01:01

Trade GOLD, Share 1,000,000 USDT

Trade GOLD, Share 1,000,000 USDTTrade GOLD, Share 1,000,000 USDT

0 fees, up to 1,000x leverage, deep liquidity