XRP Is Bleeding Fast, Could Get Ugly If Price Crosses This Line
XRP price has been going down, with more than a 30% dip in 2026. The move has been sharp, fast, and uncomfortable to watch, especially for anyone tracking momentum indicators instead of daily candles.
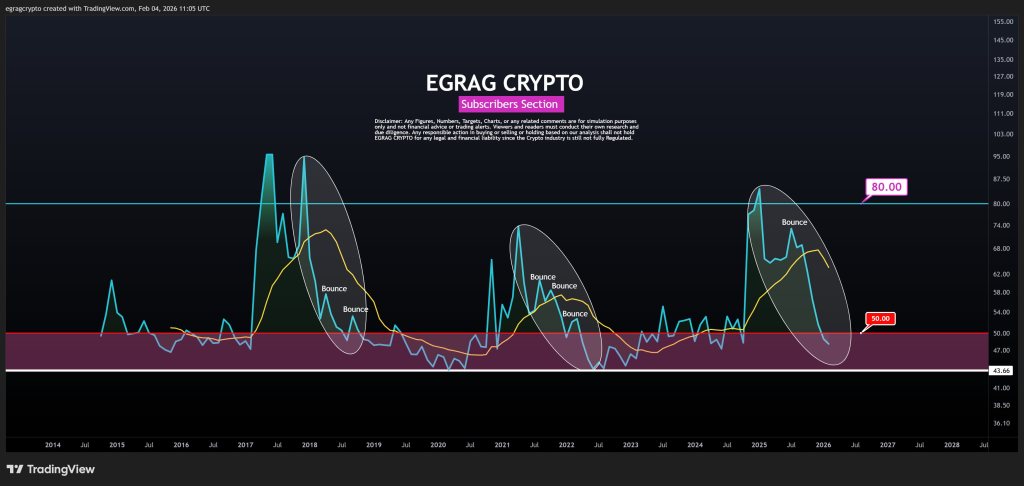
Data shared by analyst EGRAG CRYPTO puts the spotlight on one specific line that keeps coming back in XRP history. That line sits near the RSI 50 zone, and price action around it has rarely been calm.
The latest chart shows XRP sliding quickly from higher momentum levels toward a familiar pressure area. The speed of that drop matters, because fast moves often force reactions before participants fully process what is happening. This time feels no different, and EGRAG CRYPTO has been clear about why the current setup deserves attention.
EGRAG CRYPTO points out that the RSI reached the 50 zone much faster than expected. That detail sets the tone for the entire XRP price outlook. Historically, XRP RSI touching this area has acted like a compressed spring. Price rarely lingers there comfortably. Moves either bounce hard or dig deeper.
 @egragcrypto / X
The chart shows several past cycles where RSI cooled down after a strong run, paused near 50, then snapped upward. Those moments often came after aggressive downside candles that cleared out weaker positions. EGRAG CRYPTO stresses that this type of selling pressure does not match retail behavior. Large holders typically create these sharp resets.
This helps explain why the decline feels heavy without looking chaotic. XRP price is not collapsing candle by candle. The structure remains controlled, even as momentum cools quickly.
Why The XRP RSI 50 Zone Has A Long History
The RSI 50 area carries weight in XRP history. EGRAG CRYPTO highlights that this zone has never fully failed across prior macro cycles. Each visit acted as a reset phase instead of a breakdown signal. The chart circles multiple moments where RSI hovered near this band before price found its footing.
That history matters because technical memory tends to repeat. Market makers often push price deeper than expected to finish liquidity sweeps. EGRAG CRYPTO explains that these moves feel uncomfortable by design. Weak hands exit, momentum resets, and structure stays intact as long as RSI holds above the critical lower boundary.
XRP Price Outlook Hinges On One Critical Line
The level that changes everything sits near RSI 43. EGRAG CRYPTO makes this line clear. Above it, XRP price structure remains intact. Below it, the narrative changes. This does not mean instant collapse. It means the reset phase could extend and pressure could intensify.
The attached chart visually reinforces this point. Each highlighted bounce began near the same RSI compression area. Each bounce followed a period where price looked weak and confidence felt thin. XRP price currently sits close enough to that boundary to keep both scenarios on the table.
Ripple remains active behind the scenes, even as XRP price cools. Market structure does not exist in isolation. Liquidity behavior often disconnects from headlines during reset phases. EGRAG CRYPTO emphasizes that reset does not equal reversal. Cooling does not equal collapse.
Read Also: Why Ethereum Is Getting Wrecked Right Now – Don’t Touch It
That distinction matters for interpreting XRP price outlook. RSI topping near 80 earlier in the cycle fits normal post run behavior. The current move fits historical rhythm, not a sudden structural failure.
XRP price is bleeding fast, no doubt about that. The reason this moment stands out comes down to history, structure, and one stubborn RSI band that refuses to break easily. EGRAG CRYPTO continues to frame this phase as a full reset, not a bearish endgame.
Subscribe to our YouTube channel for daily crypto updates, market insights, and expert analysis.
The post XRP Is Bleeding Fast, Could Get Ugly If Price Crosses This Line appeared first on CaptainAltcoin.


You May Also Like

US forces’ odds of entering Iran by April 30 rise to 66% after Isfahan strike

Ripple CEO Reacts to BBB Rating for Ripple Prime, Lists Three Points It Validates