Hedera Hashgraph (HBAR) Selling Pressure Hits Support and $0.126–$0.177 Resistance Zone
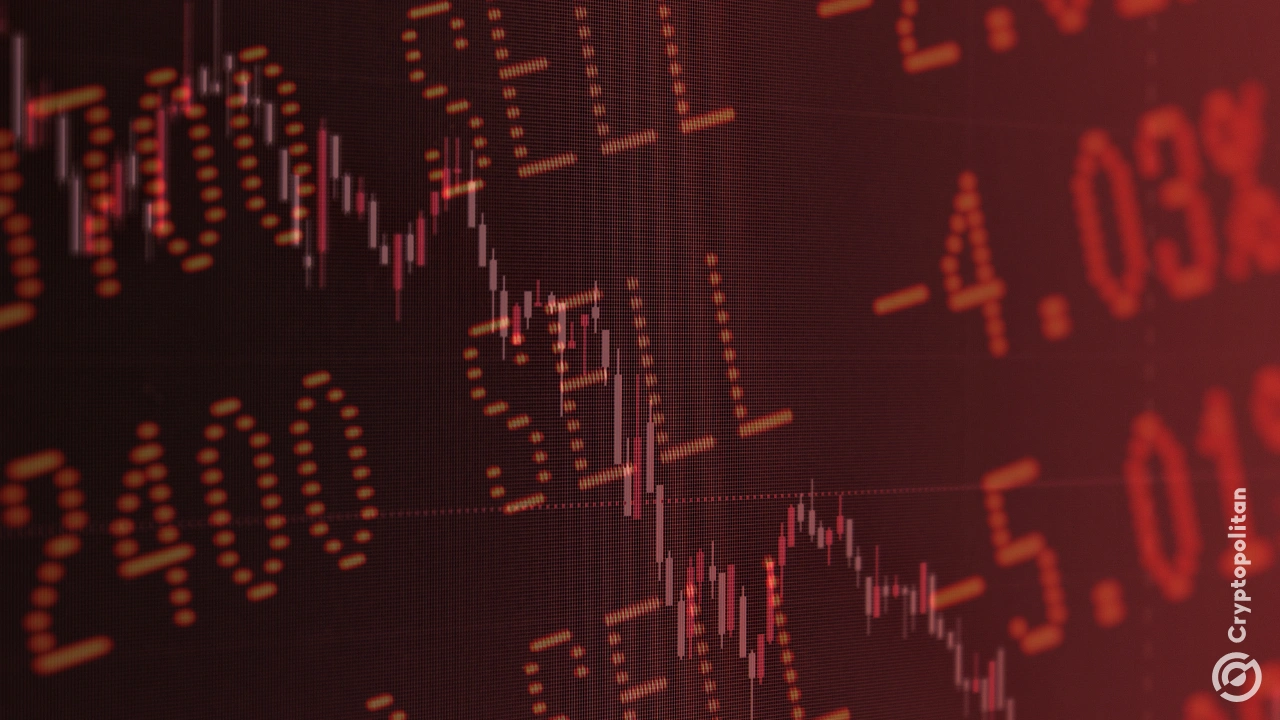
Hedera Hashgraph (HBAR) declined on February 6 as selling pressure increased, causing the asset to fall to a major technical support level. This has increased the possibility of the asset declining further. This comes as the altcoin market has declined, and investors are waiting to see whether the asset can stabilize or continue declining.
At the time of writing, Hedera Hashgraph is trading at $0.08172 with a 24-hour trading volume of $642 million and a market capitalization of $3.58 billion, according to CoinMarketCap. The token is down about 5.84% over the last 24 hours and more than 16% on the weekly chart, highlighting sustained bearish momentum and cautious short-term sentiment.
HBAR Tests Key Support Resistance
Popular crypto analyst More Crypto Online, stating that HBAR is retesting its low from October 10th around the $0.072 area, as shared on X on February 6, 2026. The observation from the post was that, although there has been some reaction to this level, there has not been enough confirmation to say that this level has been established as a solid bottom for HBAR.
On the other side, immediate resistance is located close to a descending trendline, followed by a more significant supply zone ranging from $0.126 to $0.177. In case the first support does not hold, a potential zone of interest could be located around $0.046.
Also Read | Corporate Bitcoin Strategies Must Evolve to Unlock Massive $100B Opportunity
Hedera Hashgraph Faces Technical Pressure
Technically, the weekly indicators show that the asset continues to be under pressure. The Relative Strength Index (RSI) stands at 29.7, which is close to the oversold region, and the signal line stands at 35.8.
Additionally, the price of Hedera Hashgraph (HBAR) is still below its major moving average group, which comprises the 20-week, 50-week, 100-week, and 200-week moving averages. These are above the current price of the asset.
MACD continues in a negative state, and the negative histogram indicates bearish momentum, but not accelerating. For an improvement in the overall sentiment, investors should look out for a MACD crossover along with an increase in buying volume and on-chain activity in the Hedera network.
Overall, the level of Hedera Hashgraph is technically sensitive. HBAR’s response at current levels of support will be crucial in determining what happens next, and therefore, the next sessions will be crucial for HBAR’s positioning in the altcoin market.
Also Read | Hyperion DeFi Expands Hyperliquid With Institutional Options Vault


You May Also Like

Jensen Huang Warns Workers to Use AI or Risk Losing Their Jobs

Adoption Leads Traders to Snorter Token