

This Analyst Makes Urgent Silver Price Prediction
Silver has been trading like a high-beta crypto coin lately. It ripped to roughly $120 earlier this year, then got slammed under $70, and now it’s trying to stabilize around the $77 area. That kind of 40%–50% round trip in a short window is not “normal commodities behavior.” It’s the type of tape that shows thin liquidity, crowded positioning, and a market that’s getting whipped by flows more than fundamentals on any given day.
That’s the backdrop for a new call from analyst Shirley, who posted a chart and laid out three key points: $90–$95 is the level to watch, the correction could last 1–2 weeks, and she expects silver to break $120 again, with a possible stretch target up at $180.
Let’s break down what her chart is actually showing, then talk about how realistic $180 really is.
What Shirley’s chart is signaling
Her TradingView chart is basically a roadmap of the last move and the likely “next steps” if silver behaves in a classic trend-reset pattern.
First, it shows the vertical dump from the $110–$120 area down into the mid-$70s. That drop wasn’t gradual. It was a straight-line flush, which usually means forced selling, stops getting hit, and a vacuum in bids. After that, the chart shows a bounce and chop, which is exactly what silver has been doing: sharp swings, then a messy consolidation as the market tries to decide if the low is in.
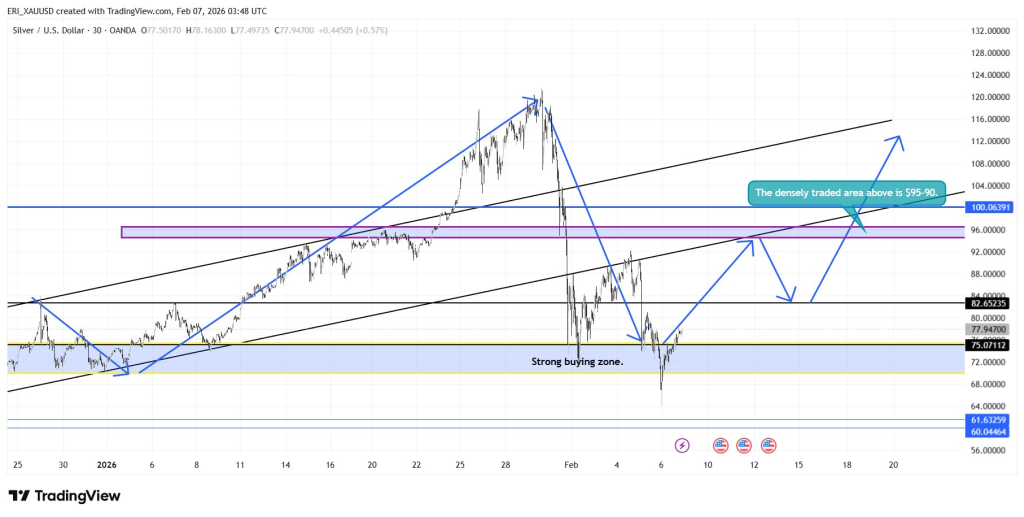 Source: X/@YShirley_XAUUSD
She’s also framing the rebound as a correction inside a bigger uptrend, not the start of a fresh bear market. On the right side, her arrows sketch an A–B–C style rebound path: push up, pull back, then continuation. That’s her “1–2 weeks of correction, then rebound resumes” idea in visual form.
Key support and resistance zones on the silver chart
Her levels are pretty clear and they line up with what traders typically watch after a violent move.
Support: $72–$75 (the “strong buying zone”)
There’s a highlighted demand area in the low-to-mid $70s, with price repeatedly reacting around it. The silver chart tags this as a strong buying zone, and it makes sense: after a crash, the first meaningful base often forms in the same region where bids stepped in aggressively the first time. If silver loses $72 cleanly, the chart’s next downside markers sit much lower.
Pivot area: ~$82–$85
The chart has a labeled level around $82.65, which reads like the first serious “prove it” area on any bounce. This zone tends to act as a speed bump because it’s where trapped sellers from the breakdown try to get out, and short-term traders take profit.
Major resistance: $90–$95 (Shirley’s main focus)
This is the heart of her call. The chart highlights a thick band in the mid-$90s and even notes that the “densely traded area” above sits around $95–$90. That’s trader language for “this is where a lot of volume changed hands before,” which usually creates heavy supply on the way back up. If silver rallies into $90–$95 and starts rejecting, that supports her idea of a short consolidation before another attempt. If silver punches through and holds above it, that’s a different story; it opens the door to the higher levels quickly.
Next upside trigger: ~$100
There’s also a clear line around $100 (the chart shows ~100.06). Getting back above $100 would be a psychological and technical win because it would put silver back into the prior range that existed before the waterfall selloff.
Read also: Silver Price at $70 Again… Last Time It Was Euphoria, Now It’s Panic
Does a 1–2 week correction window make sense?
Yes, as a trading thesis, that’s reasonable.
After a crash from $120 to sub-$70, markets rarely snap back in a straight line. They usually do two things first:
- chop around to rebuild liquidity, and
- punish late entries on both sides (bears get squeezed on sharp bounces, bulls get shaken out on sudden dumps).
At ~$77, silver looks like it’s in that rebuilding phase. A 1–2 week window for price to coil, test the lows, and set up the next direction fits the way commodities behave after a forced flush.
Read also: If You Put $5,000 Into Silver Now, What Happens by 2027?
How realistic is $180 for silver?
This is where the call shifts from “plausible” to “ambitious.”
Breaking $120 again is realistic if the market reclaims the $90–$95 zone and holds above it. Once that ceiling flips, the chart’s structure supports a run back into the old highs because a lot of the selling happened fast and left gaps in liquidity.
$180 is a different tier. For silver to reach $180, the market likely needs more than just a technical rebound. It would probably require a full-blown second leg of the bull cycle: sustained inflation fear, strong industrial demand narrative, and renewed investor flows into metals. It also tends to help when the broader macro tape turns supportive for hard assets (weaker dollar, falling real yields, risk appetite rotating into commodities). Without that kind of tailwind, $180 becomes a “late-cycle blow-off” number, not a base-case target.
A simple way to frame it: $120 is a retest. $180 is an extension. Retests happen often. Extensions happen, but usually under extreme conditions.
Subscribe to our YouTube channel for daily crypto updates, market insights, and expert analysis.
The post This Analyst Makes Urgent Silver Price Prediction appeared first on CaptainAltcoin.


You May Also Like

US missionary who contracted Ebola is on his way to Germany

B2i Digital Named Official Marketing Partner for Centurion One Capital’s Miami Summit


