

Ethereum (ETH) Price: Where’s the Bottom After 30% Weekly Plunge?
TLDR
- Ether (ETH) has crashed 30% in seven days, dropping from $2,800 to around $1,900-$2,000
- ETH open interest fell by over $15 billion during the same period, with $400 million in long liquidations in the past 24 hours
- US-based spot Ether ETFs recorded $1.1 billion in net outflows over the past two weeks
- Technical analysis suggests ETH could fall to $1,000-$1,400 range based on multiple bearish patterns and historical trends
- Key support levels to watch are $1,800, $1,580, $1,350, and $1,080 according to analyst accumulation zones
Ether has experienced a sharp decline over the past week. The cryptocurrency fell 30% in seven days, sliding from $2,800 to approximately $1,900.
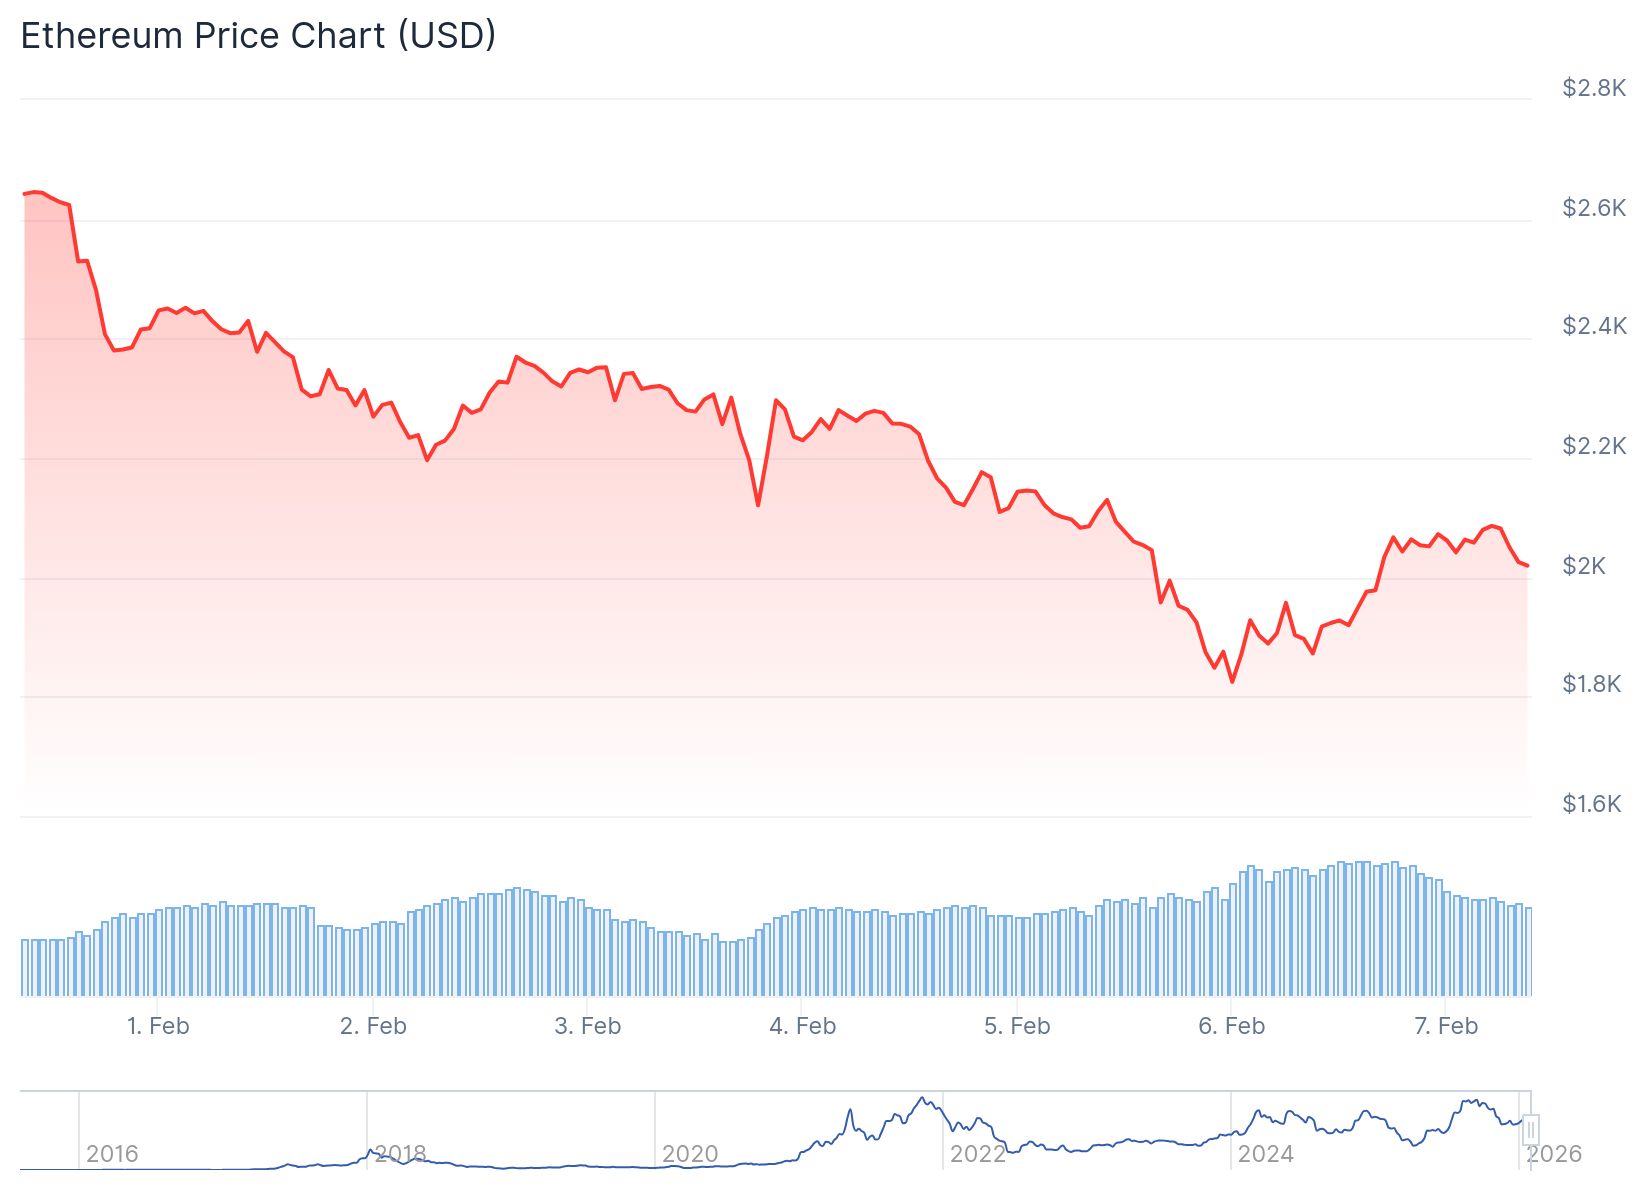 Ethereum (ETH) Price
The drop pushed ETH below the $2,000 psychological level for the first time since May 2025. On Friday, Ether reached a nine-month low of $1,740 before recovering slightly.
The decline represents the largest weekly drawdown among top cryptocurrencies. Bitcoin dropped 21% over the same period to $66,340. XRP fell more than 21% to trade above $1.37. Solana posted a 29% loss during the week.
The global crypto market capitalization declined 20% over the week to $2.23 trillion. Ether’s futures activity saw a sharp contraction. Open interest fell by more than $15 billion during the seven-day period.
Long liquidations totaled $400 million over the last 24 hours. This signals intense selling pressure from traders in the market.
Institutional Selling Pressure Mounts
US-based spot Ether ETFs recorded $1.1 billion in net outflows over the past two weeks. The selling pressure came from multiple sources beyond ETFs.
 Source: Farside Investors
Trend Research and Ethereum co-founder Vitalik Buterin both sold ETH holdings. These sales added to the overhead pressure on the price.
Ether has lost two key support levels in the past two weeks. The cryptocurrency dropped below the 200-week simple moving average and the psychological levels at $3,000 and $2,000.
The last time Ethereum decisively dropped below the 200-week SMA was in March 2025. That move was followed by a 45% price decline.
Technical Targets Point Lower
Multiple technical patterns suggest further downside potential. An inverse V-shaped pattern targets $1,385, representing a 28% drop from current prices.
An inverse cup-and-handle pattern places the downward target at $1,665. MVRV bands point to a target of $1,725.
Analysts have identified three major liquidation zones. These sit around $1,500, $1,300, and $1,000.
Onchain data from Glassnode shows little previous volume below $1,900. This suggests buyers might not step in until the price drops to lower support levels.
The next support level sits at $1,200. Approximately 1.5 million ETH were previously acquired at this price point.
Analysts have mapped key accumulation zones based on historical dollar-cost average purchases. These zones are located at $1,800, $1,580, $1,350, and $1,080.
ETH is currently trading at $2,053.14 at press time. The coin trades below both its 50-day and 200-day moving averages. This indicates extended bearish control in the market.
The post Ethereum (ETH) Price: Where’s the Bottom After 30% Weekly Plunge? appeared first on CoinCentral.


You May Also Like

Tether Files Seven Trademarks in South Korea

Trump's $1B ballroom funding on the verge of being 'ejected' by his own party


