

66% Drop? Head-and Shoulders Pattern Hints at Another Painful Correction for PEPE
Pepe (PEPE) has broken below a key neckline support, completing a textbook head-and-shoulders pattern. The move suggests further downside risk.
Meanwhile, the price is around $0.00000558 at press time, with a weekly drop of over 17%.
Pattern Structure and Target Projections
The chart posted by Ali Martinez shows a well-defined head and shoulders formation. The neckline support broke at approximately $0.0000065, triggering a bearish move. This structure is typically known for reversing uptrends when confirmed by a neckline break.
The projected target from this breakdown points toward $0.00000185. This is based on the measured move from the top of the head to the neckline and confirmed with Fibonacci levels. The chart shows possible support at $0.00000490 and $0.00000333 before reaching lower targets.
Price and Volume Trends
PEPE’s price continues to trade below its 9-day EMA. This keeps momentum tilted to the downside. The recent decline in volume adds to this view. Daily trading volume is now near $310 million, a drop of more than 50% compared to the previous day.
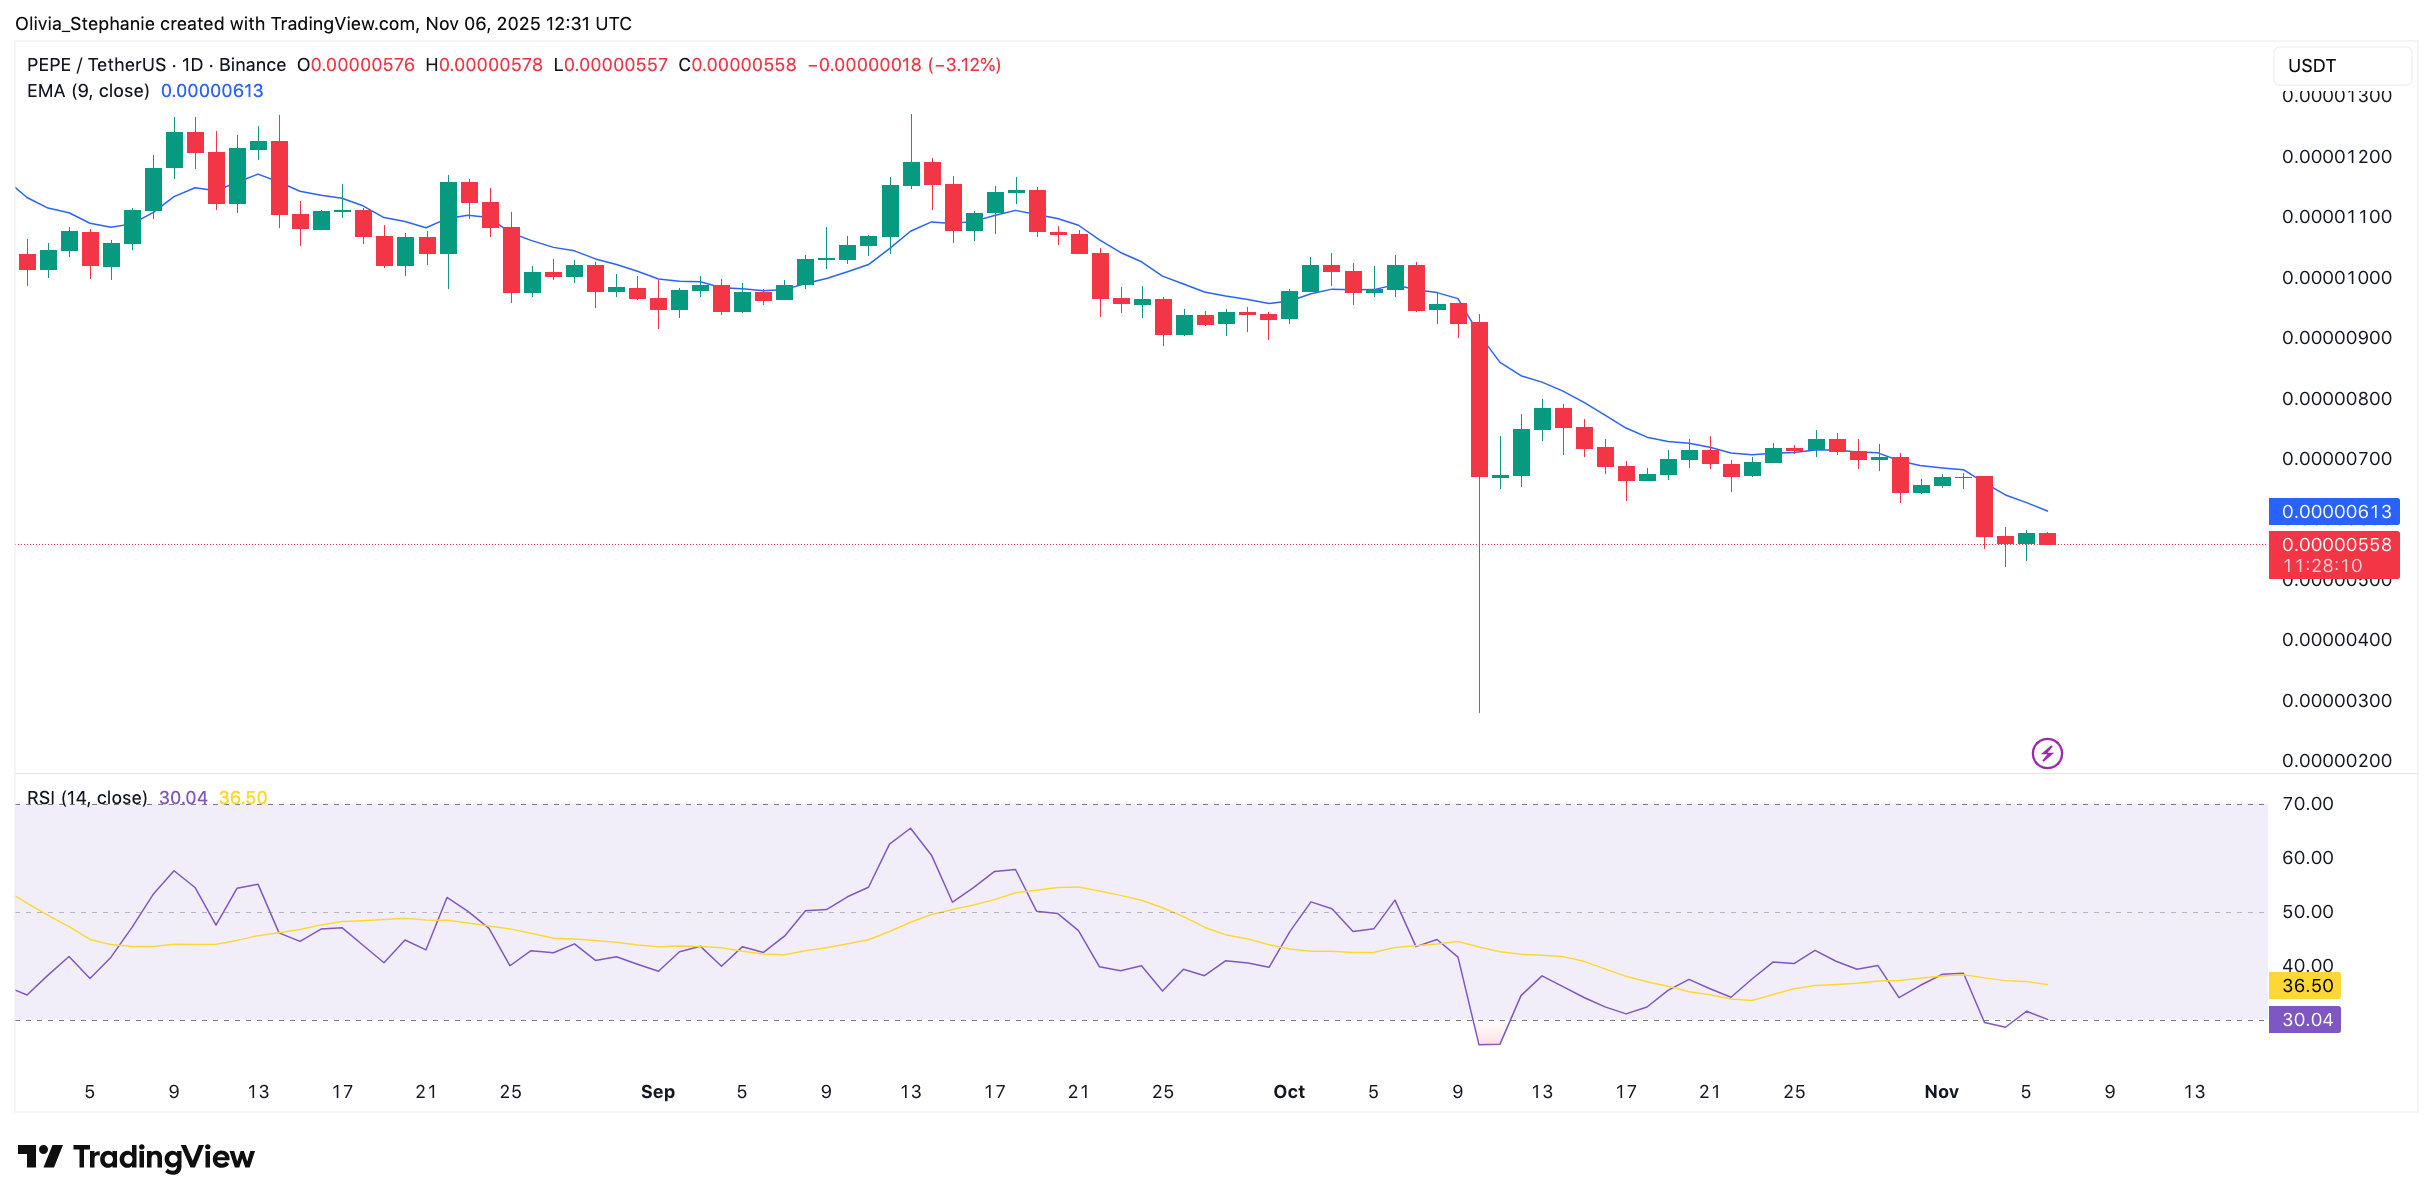 Source: TradingView
On the RSI, the reading sits at 30. This level is near oversold territory but has not yet triggered a reversal. Unless volume returns or buyers step in, the trend may remain weak in the near term.
Funding Rates Turning Positive
Data from Coinalyze shows the aggregated funding rate is now +0.0100. The predicted rate is +0.0056. Both metrics have flipped from negative to positive, suggesting some traders are positioning for a bounce. These figures often indicate a shift in sentiment, especially after a strong drop.
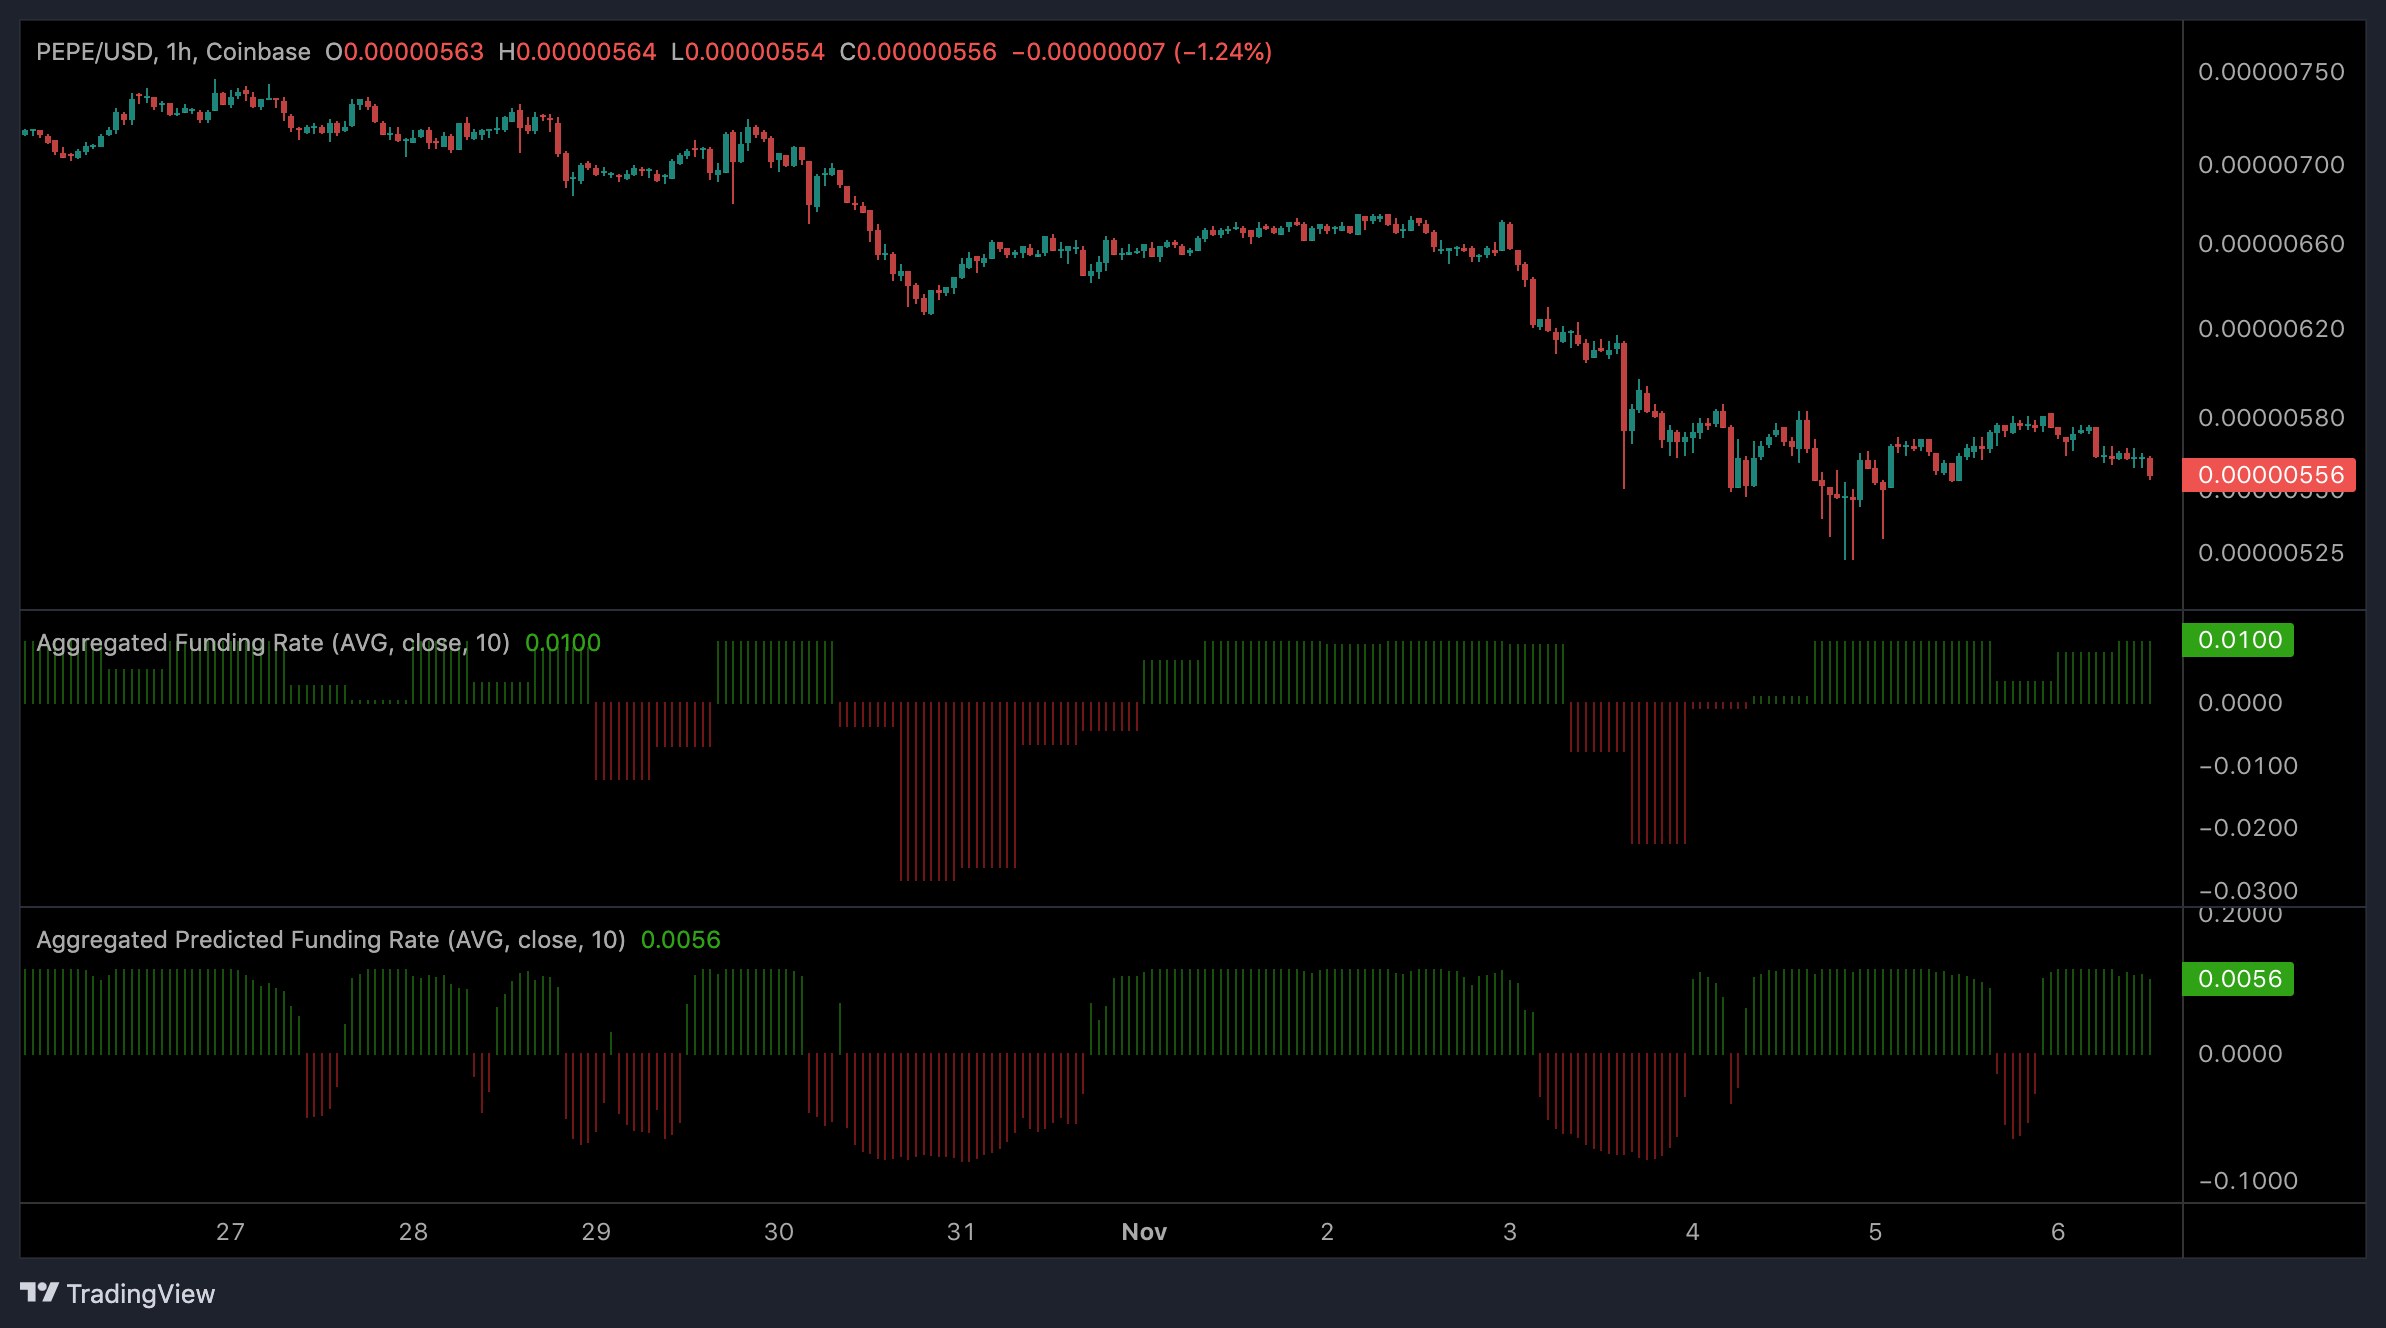 Source: Coinalyze
However, the price remains below resistance. Until levels above $0.0000065 are reclaimed, the pattern’s structure remains in play.
The current structure suggests sellers remain in control. Until the asset builds above key resistance, the next move toward the $0.00000185 target remains on the table.
The post 66% Drop? Head-and Shoulders Pattern Hints at Another Painful Correction for PEPE appeared first on CryptoPotato.
You May Also Like

Historic $720 Million Move Signals Major Crypto Asset Manager Shift
Federal Reserve expected to slash rates today, here's how it may impact crypto
Market participants are eagerly anticipating at least a 25 basis point (BPS) interest rate cut from the Federal Reserve on Wednesday. The Federal Reserve, the central bank of the United States, is expected to begin slashing interest rates on Wednesday, with analysts expecting a 25 basis point (BPS) cut and a boost to risk asset prices in the long term.Crypto prices are strongly correlated with liquidity cycles, Coin Bureau founder and market analyst Nic Puckrin said. However, while lower interest rates tend to raise asset prices long-term, Puckrin warned of a short-term price correction. “The main risk is that the move is already priced in, Puckrin said, adding, “hope is high and there’s a big chance of a ‘sell the news’ pullback. When that happens, speculative corners, memecoins in particular, are most vulnerable.”Read more


