ASTR (ASTER) Price Prediction 2026–2030: Can ASTER Hit $1.00 Soon?
- ASTR has confirmed a significant bullish breakout, surpassing its recent resistance and signaling a continuation of the upward trend into 2026.
- The RSI (Relative Strength Index) nearing overbought levels suggests a short-term consolidation could occur before the next price surge.
- Long-term outlook remains positive, with $1.00 as a realistic price target if the support levels hold steady.
ASTR (ASTER) started 2026 with a powerful surge after a decisive daily breakout on the 1D timeframe. The asset witnessed a sharp increase, closing near $0.635 after posting a daily gain of over 12%, one of its most substantial moves in recent sessions. The breakout candle pushed ASTER above key resistance levels, confirming a shift from consolidation into a more expansive upward trend.
At this point, ASTR is trading well above the 20-day Simple Moving Average (SMA), indicating positive momentum. Additionally, the widening Bollinger Bands signal an increase in volatility, which often precedes further price action. While the short-term outlook appears slightly overextended, the broader trend suggests that ASTER could be entering a sustained bullish phase if support levels continue to hold.
Market Sentiment and Momentum
The market sentiment around ASTER has flipped to bullish, with buyers strongly dominating the daily price action. The breakout candle’s strength, coupled with follow-through buying, indicates genuine accumulation, rather than a brief speculative rally. The increasing volatility suggests that ASTER is transitioning from a base-building phase into a momentum-driven phase.
However, sharp rallies often trigger short-term profit-taking. Traders are watching carefully to see if ASTER can maintain higher lows during any upcoming pullbacks, which would confirm the trend’s strength and improve the likelihood of further upside.
Also Read: Jupiter (JUP) Price Prediction 2026-2030: Will JUP Hit $0.70 Soon?
Current Market Overview
At the time of analysis, ASTER is trading at $0.635, with the asset closing strongly near session highs. The breakout has pushed ASTER above the 20-day SMA, marking a clear transition from neutral to bullish in the short term.
The price is approaching the upper Bollinger Band, which highlights aggressive upside momentum. While this confirms buyer dominance, sustained trading near or above the upper band often leads to consolidation before the next directional move. A period of sideways action above the breakout zone would help reinforce the bullish trend.
Technical Analysis
From a technical perspective, ASTER remains bullish, but signs of short-term exhaustion are beginning to appear. The price is advancing significantly faster than its underlying averages, suggesting a momentum-heavy market. The behavior of the market during any cooling-off phase will be crucial in determining the durability of the ongoing trend.
Bollinger Bands
The Bollinger Bands on the daily chart have expanded sharply, confirming a volatility-driven breakout. ASTER is currently trading near the upper band, while the mid-band (20-day SMA) remains far below the current levels, signaling the speed of the recent advance.
This setup shows strong bullish conviction, but it also suggests that the price may be overstretched in the short term. A consolidation or shallow pullback toward the mid-band area between $0.595 and $0.60 would represent a healthy technical reset and could offer a stronger foundation for continuation.
RSI Behavior
The Relative Strength Index (RSI) is currently at 51.80, approaching overbought territory. This indicates strong buying pressure and positive momentum but raises the likelihood of a brief consolidation phase or sideways movement.
In strong trends, the RSI can remain elevated for extended periods. A controlled pullback, maintaining the RSI above 45–50, would signal sustained bullish momentum. A sharper drop below 45 would suggest weakening demand and increase downside risk.
Support and Resistance Levels
Immediate support for ASTER lies in the $0.59–$0.60 range, corresponding with the recent breakout zone and previous consolidation highs. Holding above this level would preserve the bullish market structure. Additional support sits near $0.50, which aligns with the rising 20-day SMA.
On the upside, immediate resistance is near the $0.70 psychological level. A sustained breakout above this zone could open the door for higher targets at $0.75 and $0.80, with $0.85 emerging as a major long-term target if momentum remains strong.
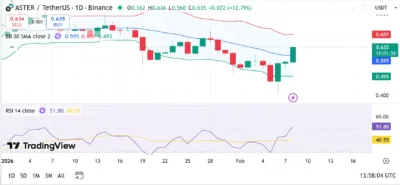
Source: Tradingview
ASTER Price Predictions (2026–2030)
| Year | Minimum Price | Average Price | Maximum Price |
|---|---|---|---|
| 2026 | $0.60 | $0.635 | $0.70 |
| 2027 | $0.65 | $0.75 | $0.80 |
| 2028 | $0.75 | $0.85 | $0.90 |
| 2029 | $0.80 | $0.90 | $1.00 |
| 2030 | $0.90 | $1.00 | $1.10 |
2026
In 2026, ASTER is expected to continue experiencing volatility following its breakout. If the price can maintain support above the $0.60–$0.65 range, the asset could stabilize at significantly higher levels compared to 2025. Consolidation phases, followed by renewed momentum, could push ASTER toward the $0.70–$0.75 range.
2027
By 2027, improving liquidity and a broader market rally could support a more structured uptrend. If overall market sentiment remains favorable, ASTER could benefit from increased holder confidence, allowing the price to approach $0.80 with reduced downside risk.
2028
In 2028, ASTER may experience further speculative waves within the altcoin market. While wider trading ranges are likely, the overall trend may remain bullish. A price move toward $0.90 would represent a significant long-term milestone.
2029
As ASTER matures, it could establish stronger price stability above $0.80. Pullbacks would increasingly be seen as accumulation opportunities. Growing liquidity and market interest could push ASTER toward the $1.00 region during bullish phases.
2030
By 2030, ASTER’s long-term performance will depend on broader adoption and market cycles. With favorable conditions, the asset could enter a new growth phase, potentially reaching $1.10, driven by deeper liquidity and sustained investor interest.
Conclusion
ASTER enters 2026 in a technically strong position following a decisive breakout above key resistance. While near-overbought conditions suggest a brief consolidation, the broader trend remains bullish, with $0.70 emerging as a realistic target in the near term.
If ASTER can continue to build on its current momentum and successfully navigate any consolidation phases, a move toward $0.85 or higher becomes increasingly likely over the next few years.
FAQs
1.What is the current market sentiment for ASTER in 2026?
Market sentiment is strongly bullish, driven by a clean breakout and sustained buying pressure.
2. Is ASTER currently overbought?
The RSI is approaching overbought levels, indicating strong momentum but also suggesting the possibility of short-term consolidation.
3. Can ASTER hit $1.00 soon?
If the price maintains support above $0.60–$0.65 and the bullish momentum continues, $0.70 becomes a realistic target.
4. What are the key levels to watch for ASTER?
Key support lies at $0.60, with resistance at $0.70 and higher levels around $0.80.
5. What is the long-term outlook for ASTER?
With favorable market conditions, ASTER could appreciate toward $1.10 by 2030, supported by growing liquidity and broader adoption.
Also Read: Pyth Network (PYTH) Price Prediction 2026-2030: Will PYTH Hit $0.078 Soon?
The post ASTR (ASTER) Price Prediction 2026–2030: Can ASTER Hit $1.00 Soon? appeared first on 36Crypto.


You May Also Like

ASML (ASML) Stock; Slips as High-NA Chips Near First Production Milestone

China Nabs Another Huione Group Core Member in Cambodia Extradition