

Bitcoin Price Weakens After Relief Rally Fails at $71,000
Bitcoin price momentum has weakened again after a sharp rebound ran into firm resistance close to $71,000, reinforcing fears that the recent move may be temporary rather than the start of a new uptrend. Real-time market data shows BTC trading near $69,061, a level that reflects hesitation more than strength.
Traders now view the surge from the low-$60,000 range as a classic relief rally inside a broader corrective phase rather than a decisive recovery.
According to the source, shrinking liquidity, fragile sentiment, and persistent selling pressure from investors seeking better exit levels are combining to cap upside progress. These overlapping forces often appear after major cycle peaks, making the current structure especially important for analysts, students of finance, and blockchain professionals tracking long-term market behavior.
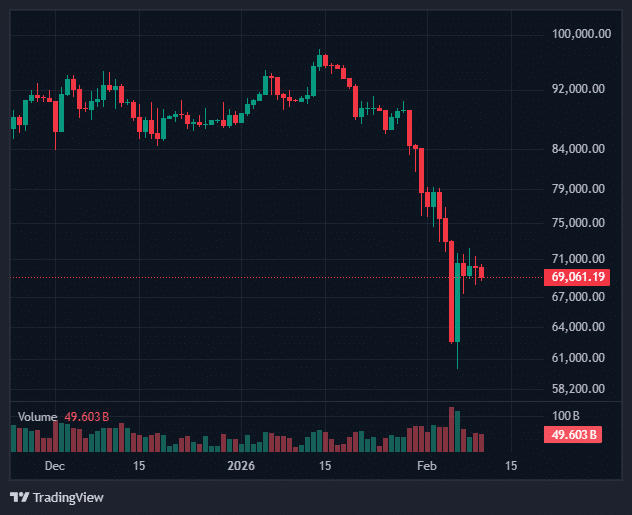 Source: Coinmarketcap
Exit Supply and Macro Resistance Reshape the Bitcoin Price Path
The latest Bitcoin price rebound followed a capitulation-style drop that quickly attracted dip buyers. However, that renewed demand also created an opportunity for trapped holders to sell into strength. This supply overhang explains why upward momentum faded as price approached the $70K to $71K region.
FxPro chief analyst Alex Kuptsikevich highlighted two separate risks shaping the outlook. First, he warned that heavy exit supply during rebounds could push BTC toward another test of the 200-week moving average near $60,000. Second, he noted that recovery momentum stalled alongside a broader sell-off near the $2.4 trillion total crypto market value, suggesting the wider decline may not yet be complete. Together, these signals frame the rebound as structurally fragile rather than trend-defining.
Fear Index Returns to FTX-Era Panic, Amplifying Bitcoin Volatility
Sentiment indicators strengthen the cautious narrative. The Crypto Fear and Greed Index recently dropped to 6, matching the extreme panic recorded during the 2022 FTX collapse, before recovering slightly to 14. Even after the bounce, such readings remain historically weak and rarely align with durable bullish reversals.
Low confidence directly fuels Bitcoin volatility. When conviction disappears, traders react to short-term price movement instead of long-term fundamentals. This behavior prevents stable accumulation and leaves the Bitcoin price vulnerable to sudden swings triggered by relatively small trades.
Thin Liquidity Explains Sharp Swings Without True Capitulation
Market structure reveals a deeper mechanism behind current instability. Thin order books allow modest selling pressure to create outsized price drops, which then trigger stop-loss orders and forced liquidations. Each liquidation adds new selling, forming a feedback loop that intensifies Bitcoin volatility even in the absence of panic-level trading volume.
This dynamic explains a critical point. Prices can fall sharply without reaching a true capitulation bottom. Heavy panic volume usually signals that sellers are exhausted. Today’s quieter declines suggest exhaustion has not yet occurred, leaving the Bitcoin price exposed to further downside risk.
Retail Investors Are Quietly Stepping Away From The Market
Trading data shows another subtle but meaningful shift. Aggregate spot volume across major exchanges has declined by roughly 30 percent since late 2025, dropping from about $1 trillion to $700 billion per month. Rather than a sudden crash-driven exit, the evidence points to retail participants gradually leaving the market.
This distinction matters for stability. Panic selling often clears weak hands quickly and forms durable bottoms. Slow withdrawal, by contrast, erodes support over time and sustains Bitcoin volatility. Without renewed participation, rallies struggle to gain traction and the Bitcoin price remains structurally fragile.
Halving-Cycle History Suggests Patience, Not Speed, Defines Bottoms
Cycle analysis adds further context. Bitcoin’s retreat from the ~$126,000 peak into the $60K to $70K range represents a drawdown exceeding fifty percent, a pattern consistent with prior post-halving corrections. Historically, such bottoms take months to form and frequently include multiple failed rallies before a lasting recovery begins.
If buyers continue defending the $60,000 support zone, the Bitcoin price could enter a prolonged consolidation marked by elevated Bitcoin volatility but limited directional movement. A decisive breakdown, however, would signal that the corrective phase still has room to deepen.
Conclusion
The rejection near $71,000 shows a market driven more by fear, supply, and weak liquidity than optimism. FTX-level sentiment, fading retail activity, and liquidation pressure continue to weigh on the Bitcoin price and sustain high Bitcoin volatility.
Lasting recoveries usually form slowly with stronger confidence and trading volume. Until those signals appear, caution remains key, and the $60,000 level will decide whether consolidation begins or losses deepen.
This article is for informational purposes only and does not constitute financial advice. Readers should conduct their own research before making investment decisions.
Glossary of Key Terms
Relief Rally: A brief price rise during a larger downtrend, often driven by temporary buying before sellers return.
200-Week Moving Average: A long-term trend line used to identify major support or deeper bearish risk for Bitcoin.
Market Sentiment: Investor mood or confidence, which strongly affects price direction and volatility.
Liquidity: How easily Bitcoin can be bought or sold without causing large price swings.
FAQs About Bitcoin Price
1. Why did Bitcoin stop rising near $71,000?
Strong selling during the rebound created resistance and turned the move into a short relief rally.
2. What does the Fear and Greed Index falling to 6 indicate?
It signals extreme fear, similar to panic levels seen during the 2022 FTX collapse.
3. Why is declining trading volume important for Bitcoin’s outlook?
Lower volume shows fading participation, which weakens support and raises volatility risk.
4. What level matters most for Bitcoin now?
The $60,000 area near the 200-week moving average is the most critical support.
References
Coinmarketcap
Kaiko
Alternative
Read More: Bitcoin Price Weakens After Relief Rally Fails at $71,000">Bitcoin Price Weakens After Relief Rally Fails at $71,000


You May Also Like

Covéa Chooses Shift Technology as Strategic Partner for Fraud and Risk Management

Liventus Acquires Tamarack to Become the Most Comprehensive Technology Partner for Equipment Finance Organizations

Bitcoin Liquidations Dethroned? A Tokenized Bet Just Posted Crypto’s Biggest Loss


