Understanding ANOVA for Pair Programming Experiments
Table of Links
Abstract and 1. Introduction
2. Experiment Definition
3. Experiment Design and Conduct
3.1 Latin Square Designs
3.2 Subjects, Tasks and Objects
3.3 Conduct
3.4 Measures
4. Data Analysis
4.1 Model Assumptions
4.2 Analysis of Variance (ANOVA)
4.3 Treatment Comparisons
4.4 Effect Size and Power Analysis
5. Experiment Limitations and 5.1 Threats to the Conclusion Validity
5.2 Threats to Internal Validity
5.3 Threats to Construct Validity
5.4 Threats to External Validity
6. Discussion and 6.1 Duration
6.2 Effort
7. Conclusions and Further Work, and References
4. Data Analysis
Once we have the measures, we are able to test the hypotheses through statistical inferences. The statistical model associated with a Latin square design is shown in equation (1).
\ 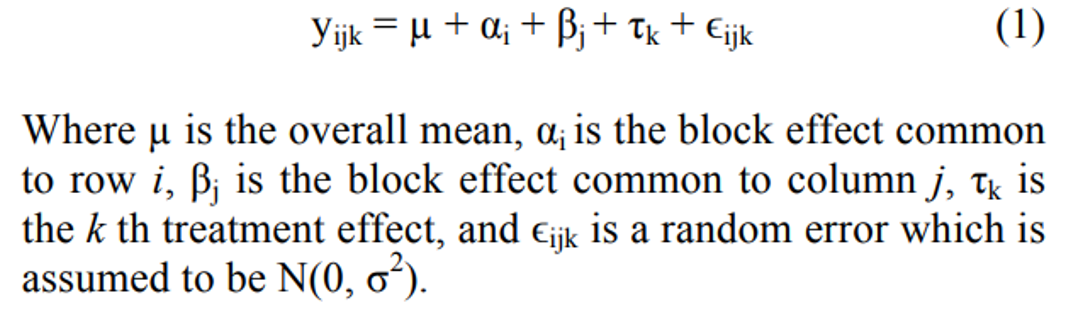
\ This design uses analysis of variance (ANOVA) to assess the components (overall mean, blocks, treatment and random error) of the model. ANOVA is based on looking at the total variability of the collected measures and the variability partition according to different components. ANOVA provides a statistical test of whether or not the means of several groups are all equal. The null hypothesis is that all groups are simply random samples of the same population. This implies that all treatments have the same effect (perhaps none). Rejecting the null hypothesis implies that different treatments result in altered effects. In this experiment, we have two groups of means (Pair and Solo programming), which are blocked by program and tool support.
\
:::info Authors:
(1) Omar S. Gómez, full time professor of Software Engineering at Mathematics Faculty of the Autonomous University of Yucatan (UADY);
(2) José L. Batún, full time professor of Statistics at Mathematics Faculty of the Autonomous University of Yucatan (UADY);
(3) Raúl A. Aguilar, Faculty of Mathematics, Autonomous University of Yucatan Merida, Yucatan 97119, Mexico.
:::
:::info This paper is available on arxiv under CC BY-NC-ND 4.0 DEED license.
:::
\


You May Also Like

Monetary Policy Stays Steady As Geopolitical Storm Clouds Gather

Schwab Trading Activity Index™: STAX Score Sees Steepest Monthly Drop Since May 2025