

Market breakdown tests conviction as Bitcoin price today slides below the $70k handle

After a violent washout that has shaken confidence, Bitcoin price today is trading well under key technical levels as fear and forced de-risking dominate the tape.
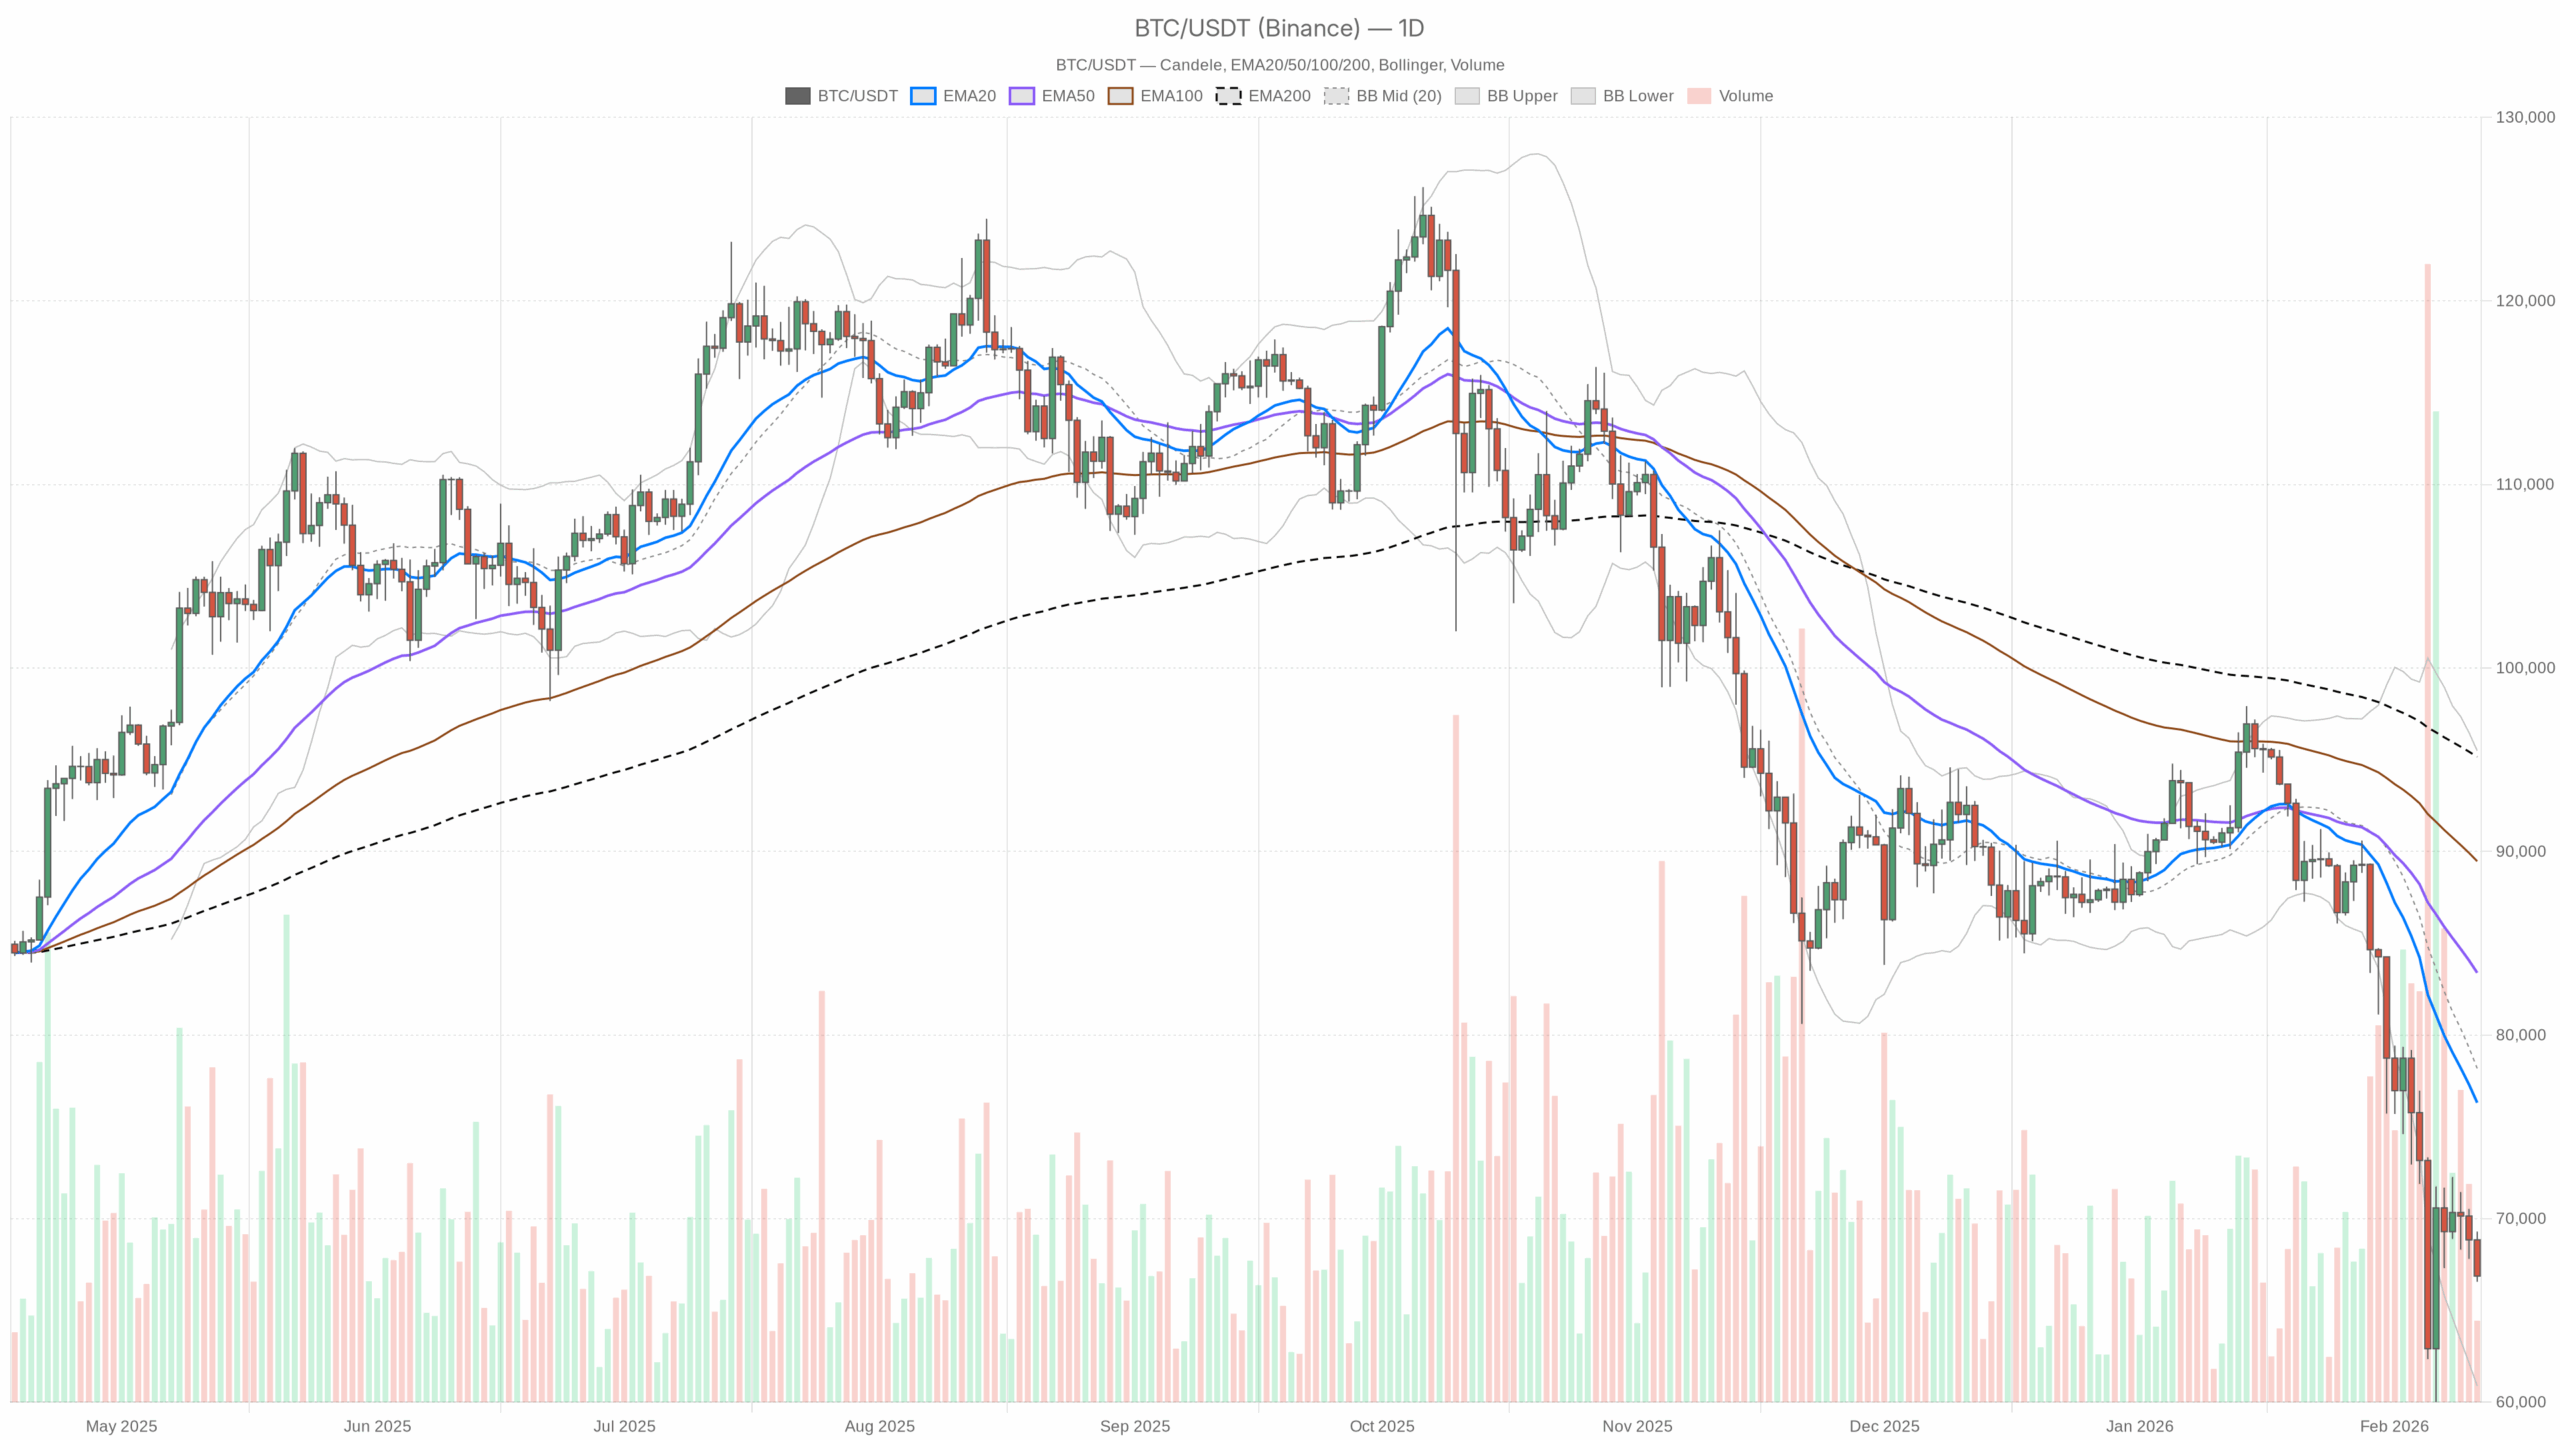 BTC/USDT — daily chart with candlesticks, EMA20/EMA50 and volume.
Daily bias: clearly bearish, with early oversold conditions
Bitcoin price today sits around $66,800–67,000 (BTCUSDT), trading below the $70k psychological line and under every major moving average on the daily chart. The dominant force right now is forced de-leveraging and risk aversion: spot and derivatives have both been hit, fear is extreme, and liquidity is thinning out on the downside rather than the upside.
This moment matters because the market is testing whether the recent high-volatility washout was a simple shakeout inside a broader bull cycle, or the start of a deeper regime shift back toward a prolonged corrective phase. The daily structure has flipped decisively bearish, while intraday timeframes are edging toward short-term exhaustion but have not yet built a credible base. Bulls are on the back foot; bears are in control, but they are also starting to lean into a crowded trade.
On the daily (D1), BTCUSDT is firmly in a bearish regime:
- Price: $66,868
- 20-day EMA: $76,314
- 50-day EMA: $83,394
- 200-day EMA: $95,155
- Regime tag: bearish
Price trading almost $10k below the 20-day EMA and far under the 50- and 200-day EMAs confirms a strong downside trend, not just a mild pullback. The entire short- to medium-term moving-average stack is above spot, which is classic downtrend structure. Moreover, rallies are, by default, at risk of being sold.
Daily RSI (14): 29.94 – dipping into oversold
RSI 14 (D1): 29.94
Daily RSI has slipped just under 30, which is early oversold territory. That tells us the selloff has been aggressive and emotional, but we are not yet in the kind of prolonged sub-25 capitulation that often marks full-blown bottoms. In practice, sellers are clearly in control, but they are starting to stretch the rubber band. Shorting fresh lows down here carries more squeeze risk than it did a few days ago.
Daily MACD: negative and widening – momentum still points down
- MACD line: -5,824.35
- Signal line: -4,964.61
- Histogram: -859.73
The MACD line is deeply negative and below the signal, with a sizeable negative histogram. That is a clean read: downside momentum is still dominant and has not yet meaningfully reversed. Any bounce for now is suspect; the trend-following signal remains short-biased on the daily, and it will take several strong green candles to flip this.
Daily EMAs: all resistance, no support
- 20 EMA (D1): $76,313.98
- 50 EMA (D1): $83,393.99
- 200 EMA (D1): $95,155.15
Price is well below all three EMAs, and each one now acts as a potential overhead supply zone:
The gap between spot and the 20-day EMA is particularly important. When price trades this far under the short-term EMA, two things usually follow: either sharp mean-reversion rallies toward the 20 EMA, or a grinding downside channel where the EMA itself chases price lower. Given the current macro fear backdrop, the path of least resistance in the very short term remains down. However, the distance to the 20 EMA also tells you that late shorts are entering at poor levels.
Daily Bollinger Bands: riding the lower band, volatility still elevated
- BB mid (20 SMA): $78,182.26
- Upper band: $95,487.67
- Lower band: $60,876.85
Bitcoin is trading well below the middle band and closer to the lower band. That fits with a downside expansion phase: price has broken out of the prior volatility envelope to the downside and is attempting to walk the lower band. The lower band near $60.9k is the next obvious volatility-anchored reference; if sellers push price into that zone, that is where you would expect liquidation-driven wicks and potential short-term capitulation.
Daily ATR (14): 5,504 – wide daily ranges, risk per trade is high
ATR 14 (D1): $5,504.74
Daily ATR north of $5.5k means one-day swings of 7–8% are absolutely on the table. That is not the quiet grinding uptrend BTC had earlier; it is a high-volatility corrective environment. Position sizing needs to account for the fact that a normal day can easily run several thousand dollars against you even if the broader idea is right.
Daily pivot levels: price hovering around the pivot, downside support nearby
- Pivot point (PP): $67,573.09
- Resistance 1 (R1): $68,588.20
- Support 1 (S1): $65,853.31
Spot is sitting roughly just below the daily pivot. That puts the market in a delicate balance zone. A push back above the pivot and then above $68.6k would mark an intraday attempt to reclaim some upside momentum, while a clean break under $65.8k opens room for a retest closer to the lower Bollinger Band around the $61k area. Traders will be watching how price reacts on either side of this $66–69k band.
Intraday structure: bearish, but short-term momentum is tiring
1-hour (H1): still in a downtrend, mild signs of seller fatigue
- Price: $66,926
- 20 EMA (H1): $68,254.5
- 50 EMA (H1): $68,968.29
- 200 EMA (H1): $71,416.82
- RSI 14 (H1): 31.72
- MACD hist (H1): -186.67
- Bollinger mid (H1): $68,497.79 (bands: $70,232 up / $66,763 down)
- ATR 14 (H1): $556.23
- Pivot point (H1): $66,956.38 (R1: $67,104.21, S1: $66,778.34)
On the 1H chart, the picture is consistent with the daily: price trades beneath all key EMAs, confirming a short-term downtrend. RSI around 32 shows selling pressure is still present, but we are inching toward intraday oversold territory. The negative MACD histogram says momentum is still down, but the size of that histogram is not extreme, hinting that the pace of the selloff is cooling a bit.
Bollinger Bands on H1 show price leaning toward the lower band near $66.8k, indicating intraday pressure remains to the downside. H1 ATR around $550 says hour-to-hour swings of almost $1,000 are normal right now, so tight stops will get hunted easily.
The H1 pivot sits almost exactly at spot. Holding below this pivot keeps the intraday bias bearish; a push above the pivot and R1 (roughly $67.1k) would be the first baby step toward a short-covering bounce. Right now, the 1H chart is saying that the market is still down, but not as violently as before.
15-minute (M15): tactical execution zone, early signs of compression
- Price: $66,886
- 20 EMA (M15): $67,327.93
- 50 EMA (M15): $67,969.77
- 200 EMA (M15): $69,014.25
- RSI 14 (M15): 33.02
- MACD hist (M15): +20.47
- Bollinger mid (M15): $67,271.87 (bands: $68,091 up / $66,453 down)
- ATR 14 (M15): $301.39
- Pivot point (M15): $66,899.08 (R1: $66,912.62, S1: $66,871.99)
On the 15-minute chart, the structure is still bearish, with price below all EMAs, but there is a subtle shift. The MACD histogram has flipped slightly positive even though the MACD line is still negative overall. That is the kind of micro-signal you get when downside momentum pauses and short-term traders start probing for a bounce.
RSI in the low 30s echoes that message: bears are pressing, but not accelerating. The ATR on M15 around $300 confirms that even intra-bar noise is substantial.
Price is trading right around the 15m pivot. Hanging here without a decisive breakdown or breakout points to a short-term consolidation inside a broader downtrend. For execution, that usually means you either wait for a clear break below the local range, under the lower band and S1, to join momentum, or a reclaim of the 20 EMA plus local highs to play for a squeeze. Chasing inside this range is where traders get chopped up.
Sentiment and macro context: extreme fear with BTC dominance rising
The broader market data adds important context:
- BTC dominance: 56.75%
- Total crypto market cap: ~$2.35 trillion
- 24h market cap change: -2.89%
- Fear & Greed Index: 11 – Extreme Fear
Bitcoin is gaining dominance while the total market cap is shrinking. That is classic flight to relative safety within crypto: capital that stays in the space is consolidating into BTC while alts bleed harder.
The fear reading at 11 is important. We are well into the panic zone, where headlines are uniformly negative, large players de-risk, and retail tends to capitulate. Historically, these conditions often coincide with or precede attractive long-term entry zones, but the timing is noisy. Markets can stay in extreme fear and grind lower longer than most expect.
News flow reinforces the shift in psychology: pieces about whales and ETFs bailing out, banks reiterating that crypto is not an asset, and commentary about Bitcoin being $70,000 too high are the typical narratives that cluster near sentiment troughs. However, from a technical perspective, none of this is yet backed by concrete reversal structures. It is just emotional fuel sloshing around a trend that is still down.
Bullish scenario: oversold bounce and mean reversion toward $75–80k
The bullish case from here is tactical, not yet structural. It relies on oversold conditions, extreme fear, and short-covering rather than clear evidence of a new uptrend.
What bulls want to see
For a durable bounce, the sequence would look roughly like this.
First, on the intraday side, BTC needs to hold above or at least quickly reclaim the $65.8k S1 daily support. Repeated rejection below that level would damage the bounce setup.
Next, on the H1 chart, bulls want to see price reclaim and hold above the 1H pivot and 20 EMA. That means sustained trading back over roughly $68.2–68.5k. This move would show that the immediate selling pressure has cooled and that shorts are starting to cover.
On the daily, an ideal bullish progression would include:
- RSI climbing back above 35–40, indicating that the worst of the oversold pressure is unwinding.
- MACD histogram shrinking toward zero, signalling decelerating downside momentum.
- A daily close back above the daily pivot (~$67.6k) and then above $70k, which would start to rebuild a higher base.
If that path plays out, a logical upside target for a mean-reversion swing is the 20-day EMA near $76.3k, with extension into the $78–80k band around the Bollinger mid and prior congestion. That is where you would expect supply to re-emerge unless the macro picture has genuinely turned.
What invalidates the bullish scenario
The bullish bounce thesis breaks down if Bitcoin prints a clean daily close below $65k and starts walking the lower Bollinger Band toward $61k with RSI stuck under 30. A continued expansion of the negative daily MACD histogram alongside that move would confirm that the market is not done flushing yet.
In that case, attempts to buy the dip are more likely to be catching a falling knife than front-running a reversal.
Bearish scenario: continuation toward $61k and potentially lower
The bearish case currently has the stronger backing from the charts: trend, momentum, and structure all lean in that direction.
What bears want to see
For continuation lower, bears want BTC to remain capped below $70k and more specifically below the cluster of intraday resistance formed by the H1 20 EMA (~$68.3k) and H1/15m Bollinger mids (~$67.3–68.5k).
A break below $65.8k (daily S1) that holds on retest would be the next signal that the path is opening toward the daily lower band around $60.9k. If price starts to ride that lower band with daily RSI hovering in the mid-20s and MACD staying deeply negative, the market is in a proper trend phase down, not just a quick spike.
From there, the obvious downside roadmap is:
- First leg: probe into $61–63k (lower Bollinger Band and volatility support).
- Potential extension: if that zone fails to attract real buyers, a deeper washout into the high $50ks becomes plausible, especially if macro or ETF flows remain hostile.
What invalidates the bearish scenario
The bearish continuation view weakens materially if Bitcoin can:
- Reclaim and hold above $70k on a daily closing basis.
- See daily RSI recover back into the 40s, showing that sellers have lost dominance.
- Print a daily MACD that starts to turn upward, with the histogram shrinking toward zero, while price holds higher lows above the recent bottom.
A weekly close back above the $76k 20-day EMA area would be a clear statement that the down-leg was corrective within a larger bull market and that bears have likely exhausted their advantage, at least in the short to medium term.
Positioning, risk, and how to think about this tape
Right now, daily trend and sentiment are aligned bearish, but the market is also short-term oversold with extreme fear. That is a tricky combination: the bigger picture favors the shorts, but the timing edge on new shorts is poor, and sharp countertrend rallies can come out of nowhere.
For active traders, this is an environment where:
- Timeframe discipline matters. Aligning with the daily downtrend but using the 1H and 15m to avoid selling right into intraday supports is key.
- Risk per trade should reflect the elevated ATR. Stops that would be wide enough in calmer markets can easily be noise here.
- Patience around key levels, $65.8k on the downside and $68–70k overhead, is likely to pay better than chasing impulsive moves in the middle of the range.
For longer-term participants, extreme fear and readings like a sub-30 daily RSI are the signs you normally see somewhere in the bottoming process, but not always at the final low. Staggered entries and a tolerance for further volatility are typically required if one is building exposure into conditions like these.
The only thing that is clear from the data is that volatility and uncertainty are high. The market has left the comfortable, trending phase and moved into a shakeout regime where both bulls and bears can be wrong-footed quickly. Overall, respecting the trend and the risk, and letting the chart confirm a turn, remains crucial before treating this as anything more than a high-volatility correction in 2024.


You May Also Like

Seturion expands European token settlement network with Societe Generale and flatexDEGIRO

AEVIS VICTORIA Shareholders Approve All Proposals at 2025 AGM

Mike Johnson 'fed up' with Trump as he ditches White House for first time: insiders


