AAVE trades at $106.85 with RSI at 30.21 signaling potential oversold bounce. Technical analysis suggests recovery to $115-120 range in coming weeks despite bearishAAVE trades at $106.85 with RSI at 30.21 signaling potential oversold bounce. Technical analysis suggests recovery to $115-120 range in coming weeks despite bearish

AAVE Price Prediction: Recovery to $115-120 Range as RSI Shows Oversold Relief

2026/02/13 01:45
4 min read

AAVE Price Prediction: Recovery to $115-120 Range as RSI Shows Oversold Relief

Zach Anderson Feb 12, 2026 17:45

AAVE trades at $106.85 with RSI at 30.21 signaling potential oversold bounce. Technical analysis suggests recovery to $115-120 range in coming weeks despite bearish momentum.

AAVE Price Prediction: Recovery to $115-120 Range as RSI Shows Oversold Relief

Aave (AAVE) is showing signs of potential recovery as the token trades at $106.85, with technical indicators suggesting an oversold bounce could be on the horizon. Despite recent bearish momentum, our AAVE price prediction indicates a possible rally toward key resistance levels in the near term.

AAVE Price Prediction Summary

Short-term target (1 week): $115-118
Medium-term forecast (1 month): $120-135 range
Bullish breakout level: $128.58 (SMA 20)
Critical support: $102.35

What Crypto Analysts Are Saying About Aave

Recent analyst forecasts from January showed optimism for AAVE's potential. Caroline Bishop predicted an "AAVE price prediction shows potential rally to $190-$195 range by February 2026, driven by oversold RSI recovery and analyst targets up to $213. Current $165 level offers entry opportunity."

However, with AAVE now trading significantly lower at $106.85, these earlier predictions appear overly optimistic given current market conditions. Joerg Hiller's analysis suggesting AAVE "could rally 18-25% from current levels" remains more realistic, which would target the $125-135 range from today's prices.

According to on-chain data and technical metrics, AAVE's current positioning suggests the token may be approaching oversold conditions that could trigger a relief rally.

AAVE Technical Analysis Breakdown

The technical landscape for AAVE presents a mixed but potentially improving picture:

RSI Analysis: At 30.21, AAVE's RSI sits in neutral territory but approaching oversold levels below 30, suggesting selling pressure may be exhausting.

Moving Average Structure: AAVE trades well below all major moving averages, with the 7-day SMA at $111.01 providing immediate resistance. The 20-day SMA at $128.58 represents a significant hurdle, while the 200-day SMA at $222.36 shows the extent of the longer-term downtrend.

MACD Signals: The MACD histogram at -0.0000 indicates bearish momentum is flatlining, potentially signaling a momentum shift. The MACD and signal lines converging at -13.8005 suggest we may be approaching a potential bullish crossover.

Bollinger Bands: With AAVE's %B position at 0.2135, the token trades closer to the lower band ($90.65) than the upper band ($166.51), indicating oversold conditions within the recent range.

Aave Price Targets: Bull vs Bear Case

Bullish Scenario

A recovery rally could target the immediate resistance at $109.90, followed by the strong resistance at $112.95. Breaking above these levels would open the path toward the 7-day SMA at $111.01 and potentially the 12-day EMA at $117.06.

The ultimate bullish target remains the 20-day SMA at $128.58, which would represent a 20% gain from current levels. This Aave forecast aligns with historical oversold bounces in the DeFi sector.

Bearish Scenario

Failure to hold immediate support at $104.60 could lead to a test of strong support at $102.35. A break below this level might trigger further selling toward the Bollinger Band lower boundary at $90.65.

The daily ATR of $11.48 suggests significant volatility remains, with potential for swift moves in either direction.

Should You Buy AAVE? Entry Strategy

Current levels around $106.85 offer a reasonable risk-reward setup for traders comfortable with volatility. Consider:

  • Immediate: $105-107 range on any dips
  • Conservative: Wait for RSI to drop below 30 for confirmed oversold conditions

Stop Loss: Place protective stops below $100 to limit downside risk

Risk Management: Given AAVE's high volatility (ATR of $11.48), position sizing should account for potential 10%+ daily moves.

Conclusion

Our AAVE price prediction suggests a potential recovery to the $115-120 range over the next 1-2 weeks, based on oversold RSI conditions and converging MACD signals. However, the broader technical picture remains challenging with AAVE trading below all major moving averages.

The medium-term Aave forecast of $120-135 depends on broader DeFi market recovery and successful defense of the $102.35 support level. Traders should remain cautious given the token's 52% decline from recent highs.

Disclaimer: Cryptocurrency price predictions are speculative and should not constitute financial advice. AAVE and all cryptocurrencies carry significant risk of loss. Always conduct your own research and never invest more than you can afford to lose.
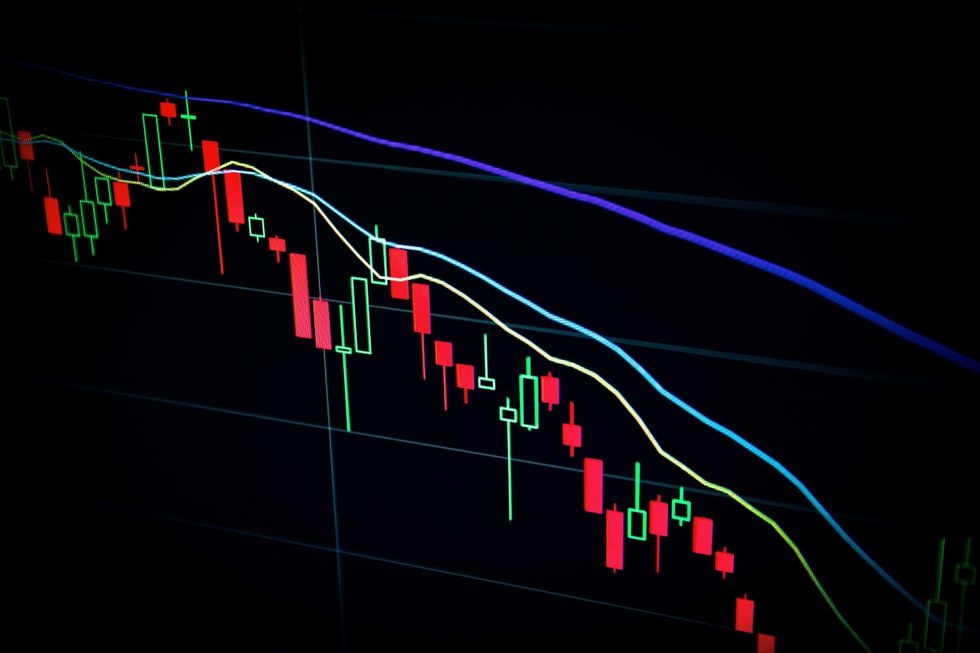
Image source: Shutterstock
  • aave price analysis
  • aave price prediction
Market Opportunity
AaveToken Logo
AaveToken Price(AAVE)
$113.6
$113.6$113.6
-1.26%
USD
AaveToken (AAVE) Live Price Chart
Disclaimer: The articles reposted on this site are sourced from public platforms and are provided for informational purposes only. They do not necessarily reflect the views of MEXC. All rights remain with the original authors. If you believe any content infringes on third-party rights, please contact [email protected] for removal. MEXC makes no guarantees regarding the accuracy, completeness, or timeliness of the content and is not responsible for any actions taken based on the information provided. The content does not constitute financial, legal, or other professional advice, nor should it be considered a recommendation or endorsement by MEXC.

You May Also Like

Siren Token Sheds 16.4% After 54% Retreat From All-Time High

Siren Token Sheds 16.4% After 54% Retreat From All-Time High

Siren token experienced a sharp 16.4% decline in the past 24 hours, trading at $0.247 as the market cap contracted by $34.4 million. Our analysis of on-chain metrics
Share
Blockchainmagazine2026/03/02 05:03
Polygon Tops RWA Rankings With $1.1B in Tokenized Assets

Polygon Tops RWA Rankings With $1.1B in Tokenized Assets

The post Polygon Tops RWA Rankings With $1.1B in Tokenized Assets appeared on BitcoinEthereumNews.com. Key Notes A new report from Dune and RWA.xyz highlights Polygon’s role in the growing RWA sector. Polygon PoS currently holds $1.13 billion in RWA Total Value Locked (TVL) across 269 assets. The network holds a 62% market share of tokenized global bonds, driven by European money market funds. The Polygon POL $0.25 24h volatility: 1.4% Market cap: $2.64 B Vol. 24h: $106.17 M network is securing a significant position in the rapidly growing tokenization space, now holding over $1.13 billion in total value locked (TVL) from Real World Assets (RWAs). This development comes as the network continues to evolve, recently deploying its major “Rio” upgrade on the Amoy testnet to enhance future scaling capabilities. This information comes from a new joint report on the state of the RWA market published on Sept. 17 by blockchain analytics firm Dune and data platform RWA.xyz. The focus on RWAs is intensifying across the industry, coinciding with events like the ongoing Real-World Asset Summit in New York. Sandeep Nailwal, CEO of the Polygon Foundation, highlighted the findings via a post on X, noting that the TVL is spread across 269 assets and 2,900 holders on the Polygon PoS chain. The Dune and https://t.co/W6WSFlHoQF report on RWA is out and it shows that RWA is happening on Polygon. Here are a few highlights: – Leading in Global Bonds: Polygon holds 62% share of tokenized global bonds (driven by Spiko’s euro MMF and Cashlink euro issues) – Spiko U.S.… — Sandeep | CEO, Polygon Foundation (※,※) (@sandeepnailwal) September 17, 2025 Key Trends From the 2025 RWA Report The joint publication, titled “RWA REPORT 2025,” offers a comprehensive look into the tokenized asset landscape, which it states has grown 224% since the start of 2024. The report identifies several key trends driving this expansion. According to…
Share
BitcoinEthereumNews2025/09/18 00:40
Whales Dump 200 Million XRP in Just 2 Weeks – Is XRP’s Price on the Verge of Collapse?

Whales Dump 200 Million XRP in Just 2 Weeks – Is XRP’s Price on the Verge of Collapse?

Whales offload 200 million XRP leaving market uncertainty behind. XRP faces potential collapse as whales drive major price shifts. Is XRP’s future in danger after massive sell-off by whales? XRP’s price has been under intense pressure recently as whales reportedly offloaded a staggering 200 million XRP over the past two weeks. This massive sell-off has raised alarms across the cryptocurrency community, as many wonder if the market is on the brink of collapse or just undergoing a temporary correction. According to crypto analyst Ali (@ali_charts), this surge in whale activity correlates directly with the price fluctuations seen in the past few weeks. XRP experienced a sharp spike in late July and early August, but the price quickly reversed as whales began to sell their holdings in large quantities. The increased volume during this period highlights the intensity of the sell-off, leaving many traders to question the future of XRP’s value. Whales have offloaded around 200 million $XRP in the last two weeks! pic.twitter.com/MiSQPpDwZM — Ali (@ali_charts) September 17, 2025 Also Read: Shiba Inu’s Price Is at a Tipping Point: Will It Break or Crash Soon? Can XRP Recover or Is a Bigger Decline Ahead? As the market absorbs the effects of the whale offload, technical indicators suggest that XRP may be facing a period of consolidation. The Relative Strength Index (RSI), currently sitting at 53.05, signals a neutral market stance, indicating that XRP could move in either direction. This leaves traders uncertain whether the XRP will break above its current resistance levels or continue to fall as more whales sell off their holdings. Source: Tradingview Additionally, the Bollinger Bands, suggest that XRP is nearing the upper limits of its range. This often points to a potential slowdown or pullback in price, further raising concerns about the future direction of the XRP. With the price currently around $3.02, many are questioning whether XRP can regain its footing or if it will continue to decline. The Aftermath of Whale Activity: Is XRP’s Future in Danger? Despite the large sell-off, XRP is not yet showing signs of total collapse. However, the market remains fragile, and the price is likely to remain volatile in the coming days. With whales continuing to influence price movements, many investors are watching closely to see if this trend will reverse or intensify. The coming weeks will be critical for determining whether XRP can stabilize or face further declines. The combination of whale offloading and technical indicators suggest that XRP’s price is at a crossroads. Traders and investors alike are waiting for clear signals to determine if the XRP will bounce back or continue its downward trajectory. Also Read: Metaplanet’s Bold Move: $15M U.S. Subsidiary to Supercharge Bitcoin Strategy The post Whales Dump 200 Million XRP in Just 2 Weeks – Is XRP’s Price on the Verge of Collapse? appeared first on 36Crypto.
Share
Coinstats2025/09/17 23:42