

Bitcoin at $60K Could Be the Deal of the Decade
Bitcoin is trading back near $69,000 now, but last week’s big dip to $60,000 is what sparked the latest wave of macro commentary. That level is now getting serious attention from long-term investors, especially after Jurrien Timmer, a director at Fidelity, pointed out that Bitcoin’s pullback may have landed exactly where cycle support was expected.
Timmer shared two charts that frame this move in a much bigger context, and the message is simple: Bitcoin’s deeper cycles may be cooling down, and that brief $60K flush could end up being a major inflection point.
Bitcoin & Liquidity: Why $60K Landed in the Support Zone
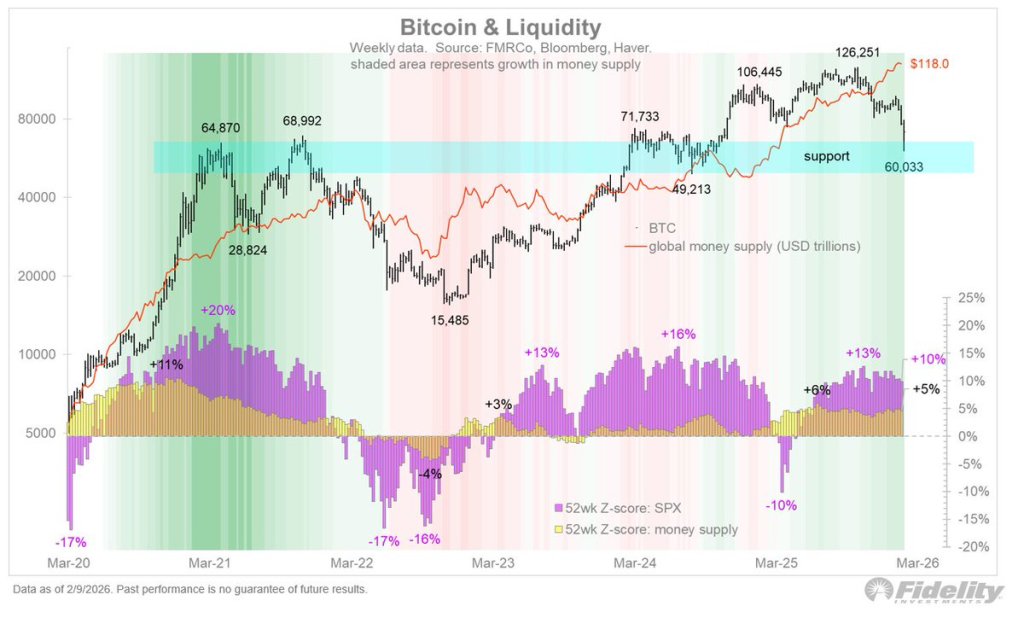
The first chart focuses on Bitcoin’s relationship with global liquidity. Timmer overlays BTC’s price with the global money supply trend, showing how closely Bitcoin has tracked liquidity expansion over the last several years.
When money supply accelerates, Bitcoin has historically responded with powerful upside moves. The 2020–2021 run is a perfect example, where expanding liquidity coincided with BTC climbing from the $10K zone into the $60K–$70K region.
When liquidity conditions tighten, the opposite tends to happen. Bitcoin often enters a reset phase where speculative excess gets flushed out.
 Source: X/@TimmerFidelity
That’s exactly what makes the $60K level so important in Timmer’s view. The chart shows a wide support band around that zone, and Bitcoin’s dip last week tagged it almost perfectly. It’s the kind of area where long-term buyers tend to step in, especially if the market is transitioning from one cycle into the next.
A key point Timmer makes is that this decline has been relatively contained. Past Bitcoin winters have been brutal, often erasing 70–80% from peak levels. A pullback to “only” $60K is shallow by historical standards, which supports the idea that Bitcoin is gradually maturing into a less extreme asset.
Bitcoin’s Road to Maturity: The Next Wave After the Reset
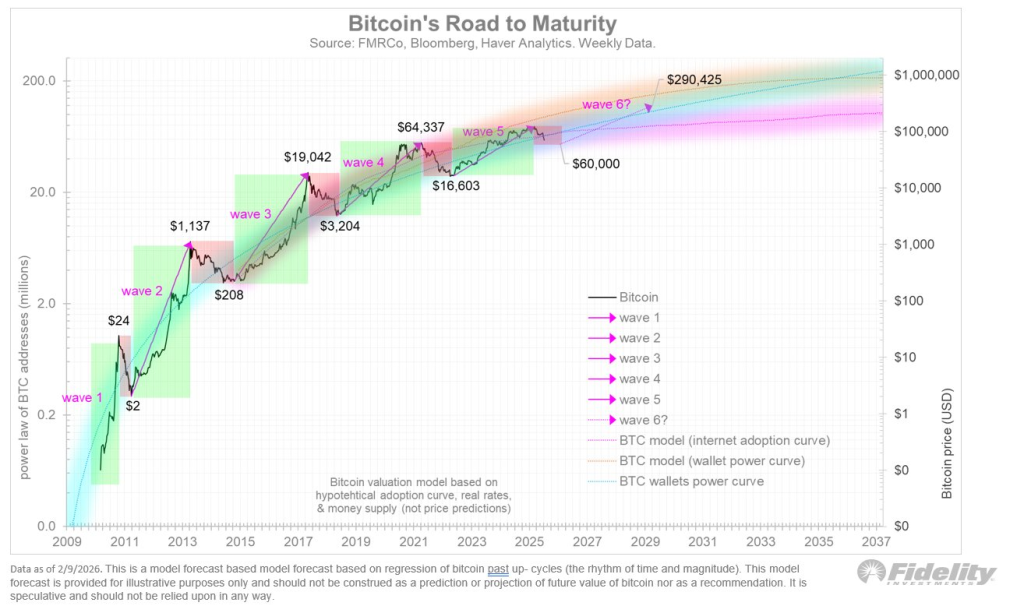
The second chart is where Timmer zooms out even further. He calls it Bitcoin’s “road to maturity,” mapping BTC’s history into distinct adoption waves stretching all the way back to the early days.
Each wave has followed a similar rhythm:
Bitcoin rallies into a major cycle peak, then corrects hard, then stabilizes before the next wave begins.
 Source: X/@TimmerFidelity
The chart labels these waves clearly; from wave 1 near single-digit prices, through wave 3 around $1,000, wave 4 near $20,000, and wave 5 around the $60K–$70K peak zone.
What stands out is how the cycles compress over time. Early Bitcoin bull markets were wild and explosive. As the asset has grown larger and more institutionally held, the moves remain powerful, but the boom-and-bust swings become less dramatic.
Timmer’s model projects that future waves could eventually carry Bitcoin toward much higher levels over the long run, with one theoretical path pointing into the $290K range. That isn’t presented as a guarantee or a clean prediction, but as a way of showing how Bitcoin’s adoption curve still has room to expand if the historical rhythm continues.
His takeaway is grounded: nobody can say with certainty that $60K was the final bottom, but it looks like a meaningful low inside a major support zone. If Bitcoin spends the next few months consolidating above that level, the next cyclical bull phase could begin forming quietly beneath the surface.
For now, $60K remains the line in the sand, and in Timmer’s view, that brief dip may end up looking more like opportunity than panic.
Read also: AI Predicts What Happens to Altcoins If Bitcoin Crashes to $50K
Subscribe to our YouTube channel for daily crypto updates, market insights, and expert analysis.
The post Bitcoin at $60K Could Be the Deal of the Decade appeared first on CaptainAltcoin.


You May Also Like

The Best Crypto Presale 2026 Could Multiply Early Entries by the Time Listing Arrives
Republicans send mixed signals after Trump topples another GOP veteran

Is BlockDAG’s Turbo the Best Crypto Presale Right Now While Bitcoin Hovers at $76K and Capital Picks Its Spots?


