

XRP Price at Crossroads as Analysts Weigh $0.80 Support or $27 Breakout
Key Insights:
- XRP price trades within a long-term ascending channel.
- Analysts noted that there is potential support around the $0.80 level.
- Breakout projections are toward the $21 and above targets.
XRP price is attracting fresh attention as several analysts point out a key technical area. Some charts point towards a deeper pullback towards channel support near $0.80.
Others believe the structure mirrors past breakout cycles that resulted in massive upside. The divergence puts Ripple (XRP) price at an inflection point.
XRP Price Tests Channel Support After Apathy Cycle Top
One widely shared ChartNerd chart framed the current XRP price action within a rising macro channel.
According to this view, XRP may have topped out in an “apathy cycle” phase rather than a euphoric blow-off.
Historically, there were strong rallies when similar setups and prices returned to lower channel support.
 XRP Chart | Source: ChartNerd, X
The chart showed previous-cycle lows forming at the bottom before major rallies. Ripple (XRP) price structure suggests a retest of the lower range. Traders anticipate this move before momentum shifts.
The market then aims to launch a new expansion phase. ChartNerd questioned whether the market will respect channel support first before any euphoric rally takes place.
Ali Charts has a similar but more cautious forecast. His weekly channel projection reveals the potential for ripple price to slide to the $0.80 region. That level coincides with a lower trend boundary and a previous consolidation zone.
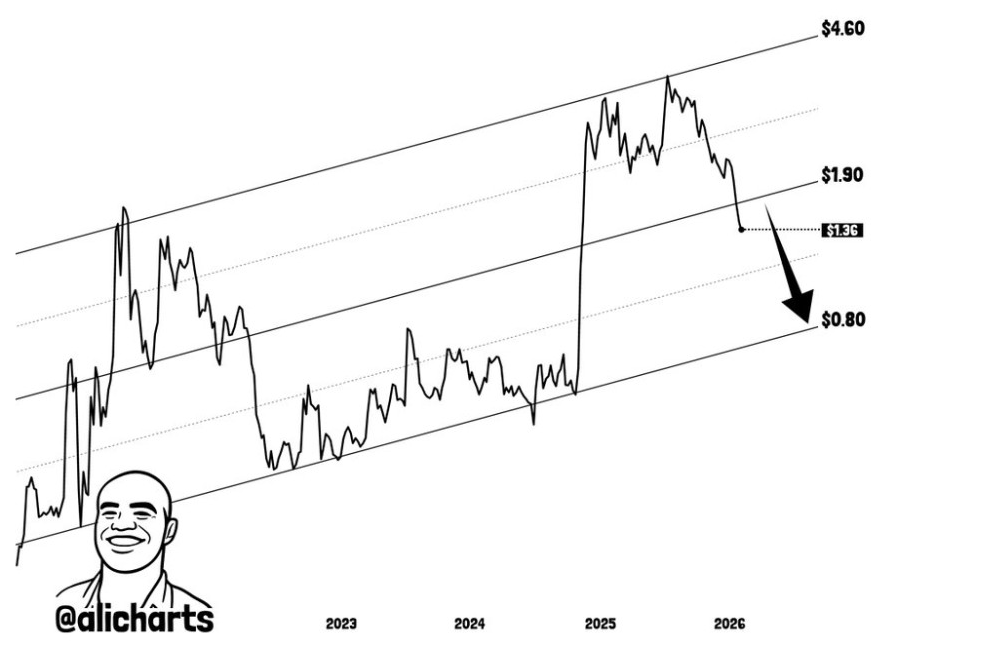 XRP Weekly Chart | Source: Ali, X
If the lower channel holds, it may provide structural support. However, a breakdown below that range would weaken the bullish channel thesis. For now, XRP price is stuck between mid-channel resistance and possible lower support.
Fractal-Based Bullish Outlook for Ripple Price
Furthermore, another view is from CryptoBull, who compared the current 3-month XRP chart to early 2017.
In that cycle, the XRP price broke out, retested the breakout zone, and then accelerated sharply. The current structure seems similar, and XRP price is consolidating near a previous line of breakout.
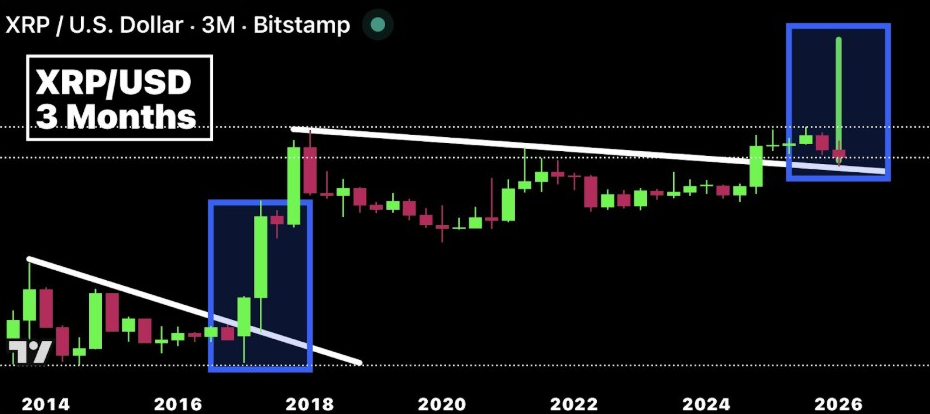 XRP/USD 3-Month Chart | Source: CryptoBull, X
CryptoBull suggests that if history repeats, the market could experience a retest followed by strong upside continuation.
His projections go into the $50 to $70 range if the completion of the long-term fractal takes place. While ambitious, the thesis is based on structural similarity rather than short-term momentum.
Fractals tend to get a lot of attention because markets can have repeating patterns. However, macro liquidity and more general crypto conditions can affect outcomes. XRP price has to maintain above key structural support levels in order to preserve the fractal scenario.
For the moment, the phase of consolidation is more like compression than breakdown. A decisive move above the level of local resistance would strengthen the bullish comparison.
Multi-Phase Structure Points Toward Fibonacci Targets
Meanwhile, CW8900 drew a four-phase structure on the XRP price chart. XRP has already passed through accumulation and consolidation.
Also, the roadmap now points toward its next phase. The asset may soon enter the final stage of expansion. The analyst found a Fibonacci 6.618 extension at near $21.5 as a possible long-term target.
 XRP/USD 3W Chart | Source: CW, X
Price coiling within a symmetrical triangle before the breakout is shown in the chart. If XRP price breaks up from this formation, it could be the start of a stronger impulsive phase.
Volume and oscillator indicators on the chart give the impression that momentum could change if buyers can take back control.
Still, confirmation relies on structural follow-through. A failed breakout would likely push XRP price back towards support zones marked by other analysts. That overlap highlighted how closely traders are paying attention to channel boundaries and breakout lines.
At press time, XRP price is trading near $1.36 and still below recent highs. The market has not yet been able to confirm if it will retest lower support or move into expansion.
The post XRP Price at Crossroads as Analysts Weigh $0.80 Support or $27 Breakout appeared first on The Market Periodical.


You May Also Like

PMI-ACP Exam Preparation: How to Use a Simulator and Practice Questions Effectively
Rubio presidency would be an 'unmitigated disaster': conservative insider

DBP Q1 income up 26%


