

Solana price confirms bull trap as local structure shifts bearish
Solana’s price invalidated its recent breakout attempt after failing to hold above key resistance, confirming a bull trap and shifting the short-term market structure back to bearish.
- Failed breakout above $88 confirms bull trap, trapping late buyers
- Rejection at the point of control signals bearish control, favoring downside rotation
- $78 support is the key level to watch, with potential reaction or swing-failure setup
Solana (SOL) price has entered a critical corrective phase after recent price action failed to sustain acceptance above major resistance levels. What initially appeared to be a bullish continuation has now revealed itself as a classic bull trap, catching late buyers before the price reversed sharply lower.
This type of failed breakout often marks an important inflection point, especially when it occurs at high-timeframe resistance and value extremes.
As price rotates back into its prior trading range, technical signals suggest that downside continuation is now the higher-probability scenario in the immediate short term.
Market participants are closely watching how Solana behaves as it approaches key support levels, where either further breakdown or a reactive bounce may emerge.
Solana price key technical points
- Bull trap confirmed above $88 resistance, invalidating the bullish breakout
- Rejection at the point of control signals weakness, favoring range rotation lower
- $78 high-timeframe support comes into focus, with Fibonacci confluence below
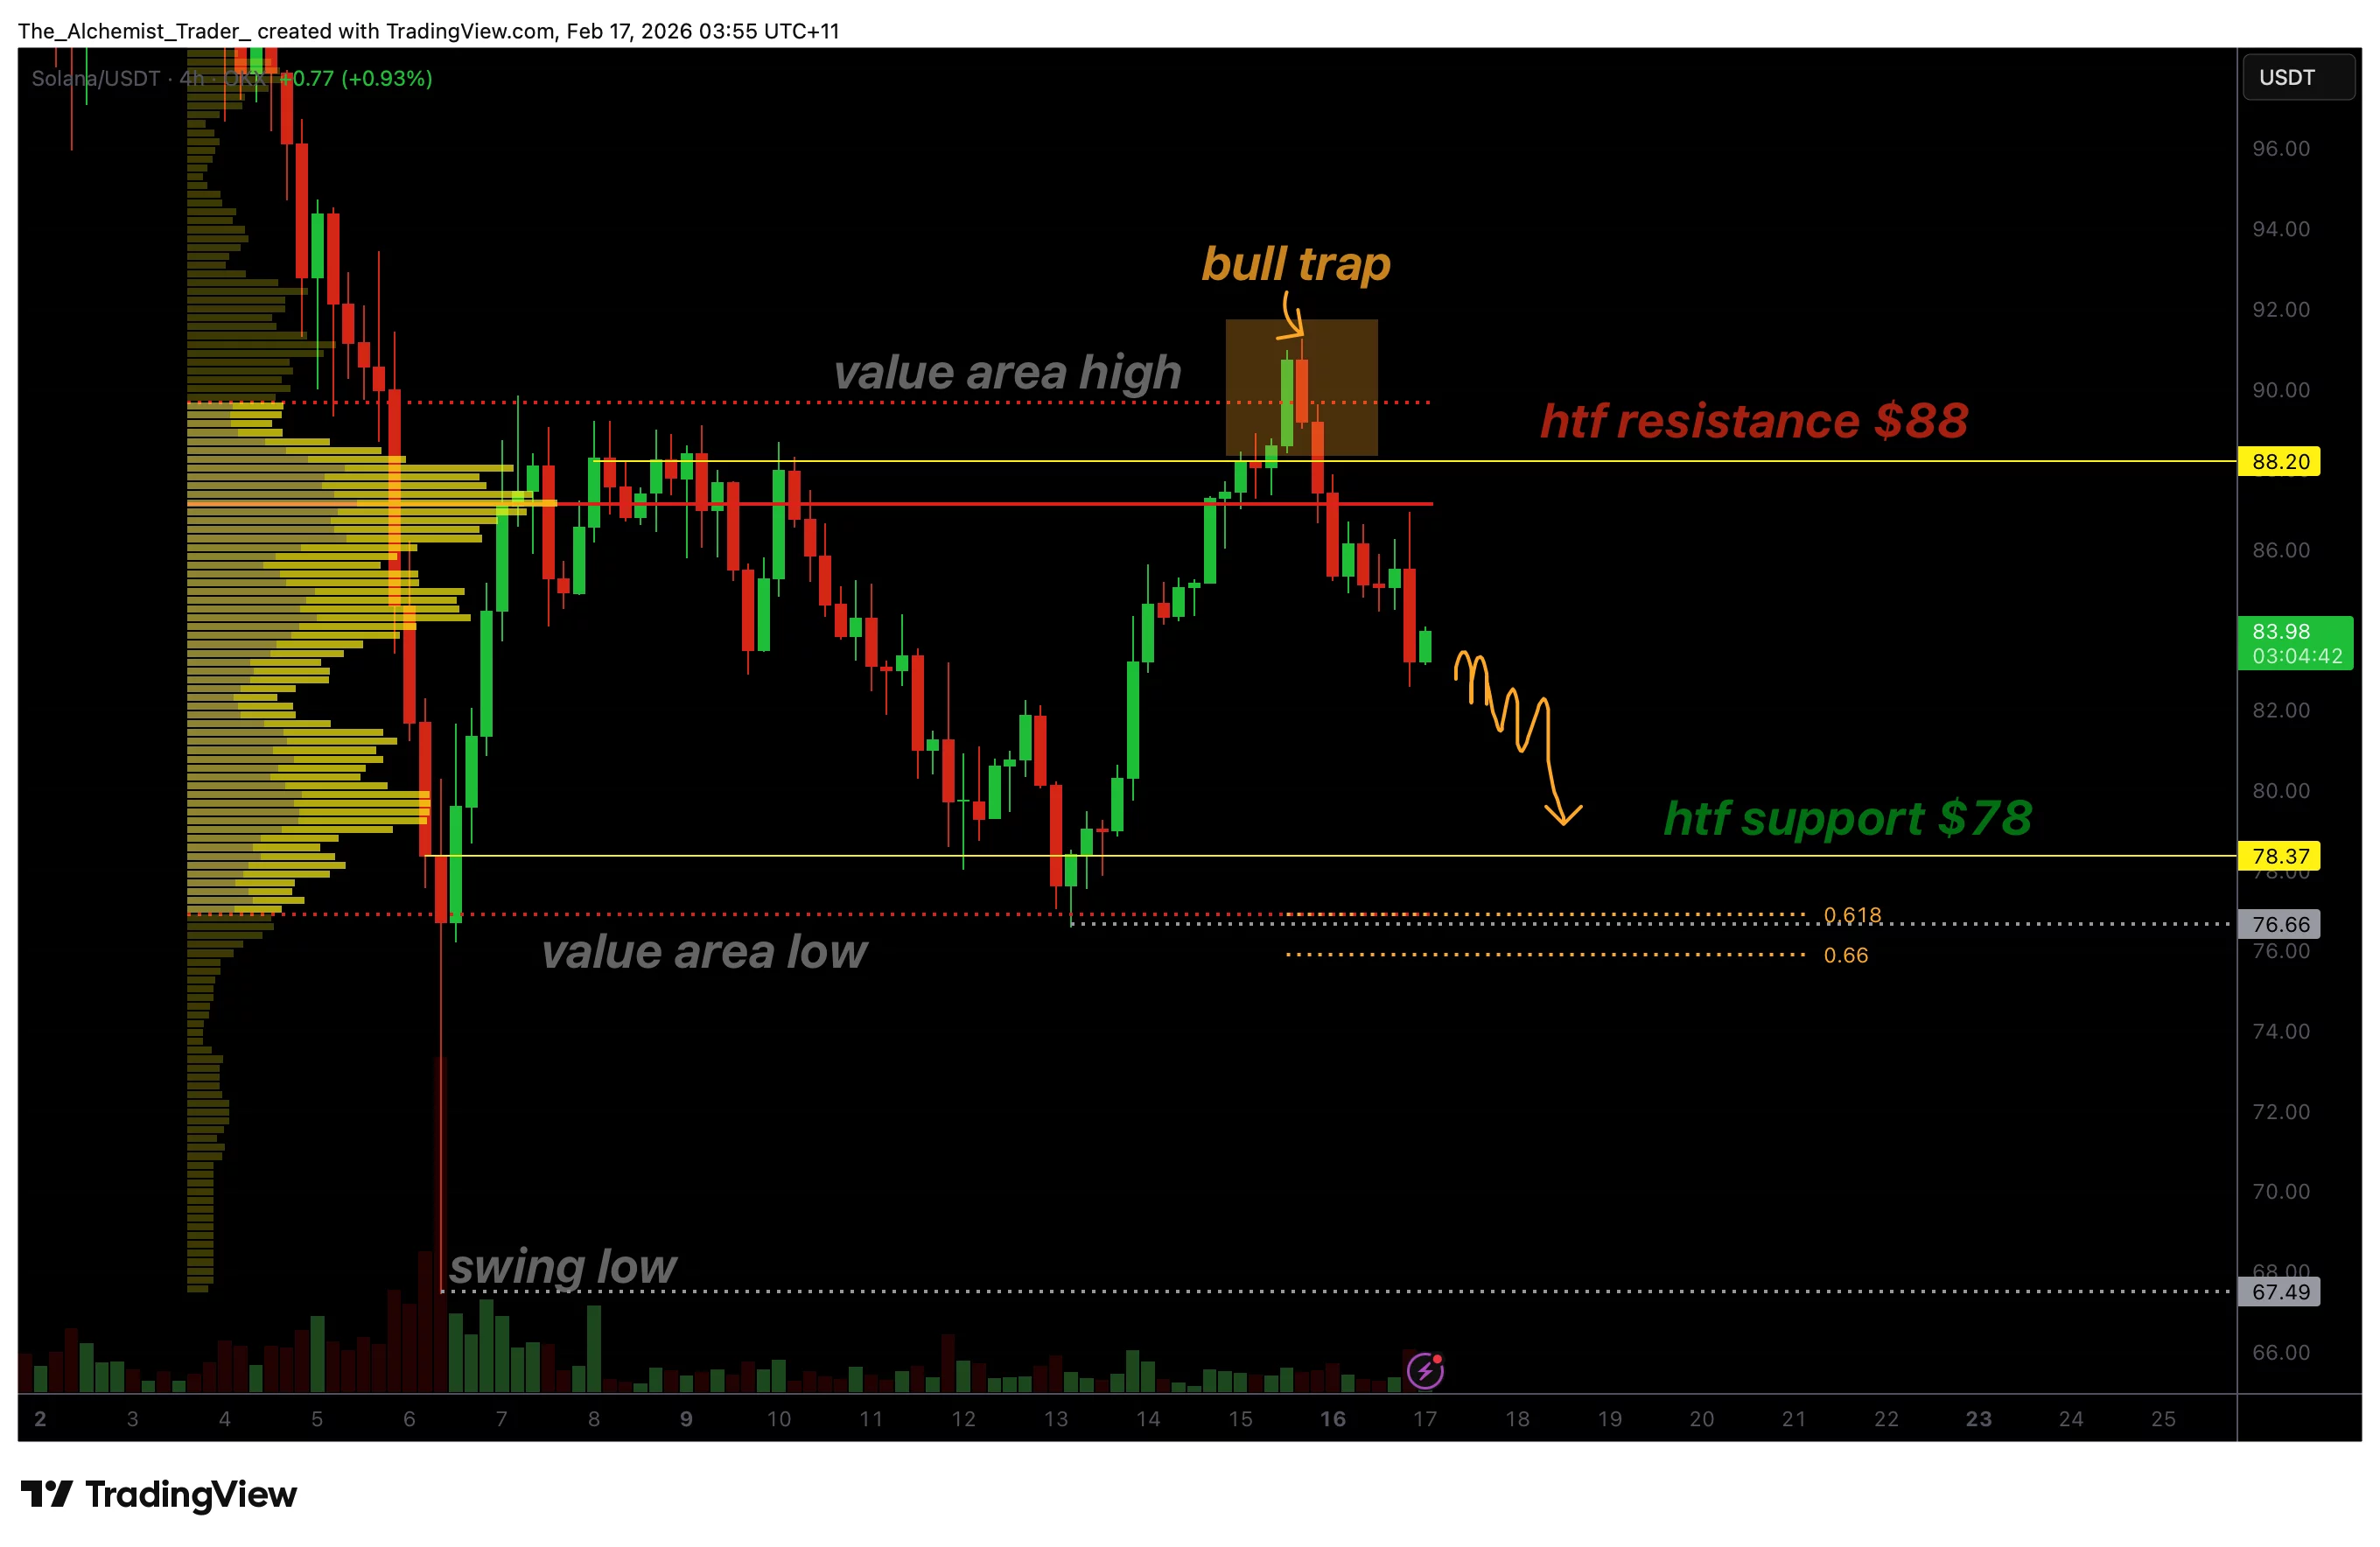
Solana’s recent rally pushed price above the value area high and into high-timeframe resistance near the $88 region. However, this move lacked sustained acceptance. Instead of consolidating above the resistance, the price quickly stalled and reversed, signaling that buyers were unable to maintain control at higher levels.
This behavior is characteristic of a bull trap, where price briefly trades above resistance to attract breakout buyers before reversing back into the prior range. Once acceptance above resistance fails, the resulting move lower is often sharp as trapped longs are forced to exit positions.
The inability to hold above the value area high was the first warning sign. This level typically defines the upper boundary of fair value within a range, and rejection here often leads to rotations back toward lower value.
Rejection at point of control confirms bearish shift
Following the failure above resistance, Solana rotated back into the trading range and attempted to stabilize near the point of control (POC). The POC represents the price level at which the highest trading volume has occurred and often serves as a balance point during consolidation phases.
However, Solana was unable to reclaim or hold above this level. The rejection at the POC confirms that sellers remain dominant and that the market has transitioned from balance into renewed imbalance. When a price is rejected at the POC after a failed breakout, it significantly increases the probability of a full-range rotation.
This rejection marks a clear shift in short-term market structure, turning the local bias bearish and opening the path toward lower support levels.
$78 support becomes the immediate downside target
With local structure now bearish, attention turns to the next major downside level. High-timeframe support near $78 stands out as the primary target. This region aligns with the value area low and represents the lower boundary of the broader trading range.
Importantly, the 0.618 Fibonacci retracement rests just below this level, adding further technical confluence. Fibonacci retracement zones often act as magnets for price during corrective phases, particularly after failed breakouts.
A move into this region would complete a full range rotation and likely coincide with increased volatility as liquidity is tested. Whether Solana stabilizes or continues to decline will depend heavily on the reaction at this support zone.
Swing failure pattern could signal reversal
While the immediate bias favors downside continuation, the $78 region is not just a bearish target — it is also a potential inflection zone. If price sweeps below this support, tests the 0.618 Fibonacci level, and then quickly reclaims the level, it could form a swing failure pattern (SFP).
Such behavior would indicate a liquidity grab rather than a true breakdown and could mark the beginning of a corrective bounce or even a larger reversal, depending on volume and follow-through. For this reason, price action around $78 should be monitored closely rather than treated as an automatic breakdown.
What to expect in the coming price action
From a technical, price action, and market structure perspective, Solana’s recent rejection confirms a bull trap and shifts short-term momentum firmly bearish. As long as the price remains below the value area high and the point of control, downside continuation toward the $78 support zone remains the higher-probability outcome.
Until bullish acceptance returns above key value levels, rallies should be treated with caution. The market is now in a corrective rotation phase, and how Solana reacts around $78 will likely define the next major move.


You May Also Like

Beyond Cleaning: What Else You Must Check Before Moving Out

Justice Department has 'gone off the rails' for Trump's 'pretzel logic': analysis


