

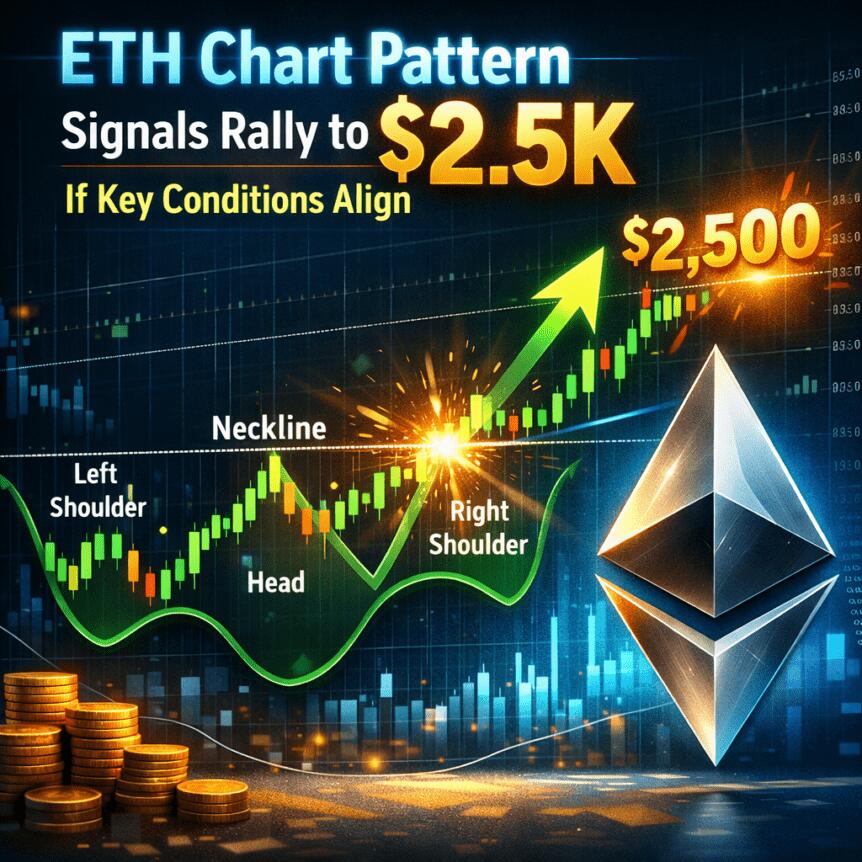
ETH Chart Pattern Signals Rally to $2.5K If Key Conditions Align
Ether began the week trading beneath the psychological $2,000 level, extending February losses to roughly a fifth of the month’s value. Yet on-chain indicators point to a strengthening undercurrent: long-term holders continue to accumulate, while network activity trends higher. With price pressure easing, analysts are assessing whether ETH’s technical footprint and the shape of derivatives data can align with a renewed demand narrative that could sustain a rally above the $2,000 mark.
Key takeaways
- Accumulation addresses added more than 2.5 million ETH in February, lifting total holdings to 26.7 million ETH for 2026.
- Ethereum’s weekly transaction count climbed to 17.3 million, while median fees slipped to $0.008, a difference of several thousand-fold from peaks in 2021.
- Approximately 30% of circulating ETH is staked, shrinking the liquid supply and potentially supporting prices over time.
- Open interest dipped to about $11.2 billion from a late‑2025 peak, yet leverage remains elevated, signaling sustained risk-taking in the derivatives market.
- Derivatives and liquidity analytics point to stacked short-liquidation zones above $2,200 and a relatively large concentration near $1,909, underscoring the potential for a liquidity-driven move if a breakout occurs.
Tickers mentioned: $ETH
Market context: The combination of rising on-chain activity and persistent leverage suggests traders are positioning for larger moves even as spot liquidity remains cautious. A break above key levels could hinge on continued accumulation signals and the evolution of open interest across major futures markets.
Why it matters
From a network fundamentals perspective, the Ethernet ecosystem is showing a paradox: price weakness coexists with strengthening usage and capital inflows. Ether (CRYPTO: ETH) as a modular asset remains central to longer-term narrative themes — digital assets that host decentralized applications, staking, and layer-2 activity — even as macro uncertainty and rate expectations shape near-term price action. The latest on-chain data implies that the supply outlook has shifted decisively through staking and active addresses, which can influence price dynamics after problematic months for risk assets overall.
On the supply side, the blockchain’s staking dynamic reduces the amount of ETH readily available for trading. CryptoQuant data indicate that a substantial portion of circulating ETH is currently staked, which tightens the floating supply and could amplify price sensitivity to demand shifts. This trend dovetails with a broad interest in ETH as a proxy for continued growth in decentralized finance and layer-2 scaling, where throughput, efficiency, and transaction costs are under scrutiny by developers and capital allocators alike.
In terms of user activity, the February surge in accumulation activity reflects a deliberate stance by long-hold participants to increase exposure in anticipation of future price catalysts. While price remains under the $2,000 ceiling, the balance of on-chain metrics — including rising transaction volumes and a growing share of ETH held by non-exchange addresses — paints a portrait of a market that is slowly recalibrating risk premia rather than capitulating to selling pressure. This dynamic matters for market participants who rely on a combination of price action and fundamental signals to gauge the sustainability of any new leg higher.
From a trading-ecosystem lens, the four-hour chart interpretation has attracted attention: the Adam and Eve bottom pattern, commonly cited as a bullish reversal framework, suggests an initial sharp decline followed by a broad base forming at lower prices. If Ether can clear the neckline around $2,150, traders anticipate a measured move that could carry prices toward the $2,473–$2,634 range, with the caveat that invalidation would come from ongoing weakness below recent swing lows near $1,909. Open interest trends and leverage levels reinforce the need for careful risk management, as a high degree of speculative activity can magnify abrupt moves if momentum shifts.
The risk-reward dynamics are further colored by liquidity maps that highlight where stress could materialize. Data-driven views show sizable short liquidation clusters above $2,200, totaling more than $2 billion in potential pressure, while long liquidations cluster around $1,800, approaching a potential liquidity magnet around that price. In such conditions, traders monitor not just price levels but the distribution of leverage across key tiers, as a squeeze in one region can accelerate a move in another. The current mix of elevated leverage with a broad base of accumulation signals implies that a decisive move could be fast, but the direction will depend on macro tone and fresh demand cues rather than pure technical momentum alone.
What to watch next
- Watch for a convincing breakout above the $2,150 neckline on ETH’s four-hour chart, which would validate the Adam and Eve bottom pattern and open a path toward the upper target zone.
- Monitor open interest changes, as renewed accumulation in derivatives markets could accompany a fresh price leg higher or, alternatively, a rapid unwinding if liquidity conditions deteriorate.
- Track liquidity hotspots around $1,909 to assess whether this level acts as a temporary magnet that sustains a bounce or a new basing point for higher prices.
- Observe shifts in the proportion of ETH staked versus liquid supply, since sustained staking inflows can influence price sensitivity to demand surges.
- Keep an eye on long/short liquidation dynamics in the $2,200–$2,400 region, which could serve as a pressure valve or accelerant depending on the prevailing market sentiment.
Sources & verification
- CryptoQuant dashboards tracking accumulation addresses and total ETH staked
- Hyblock data indicating the share of global ETH accounts currently long
- CoinGlass liquidation heatmaps showing clusters of long and short liquidations
- TradingView ETH/USDT chart illustrating the four-hour pattern and neckline levels
Ether price action and on-chain signals in focus
Ether (CRYPTO: ETH) is navigating a delicate balance between price weakness and on-chain strength. The February acceleration of accumulation addresses, with the total rising to 26.7 million ETH, points to a durable base of holders adding exposure even as spot prices traded below $2,000. The circulating supply, of which more than 30% is staked, underscores a structural shift in supply dynamics that could temper abrupt selling pressure during muscular market moves. Meanwhile, daily and weekly activity levels — ETH’s weekly transaction count cresting at 17.3 million — indicate persistent activity, even as average fees compress to a fraction of earlier cycles. This combination of rising on-chain demand and a tightening liquid supply sets the stage for a potential rebound should macro catalysts align with technical breakouts.
From a risk-management perspective, the derivatives market remains a critical barometer. Open interest has contracted from its previous cycle peak, echoing a shift in risk appetite, yet leverage metrics hold at elevated levels. The implication for traders is straightforward: while a break above key resistance could unleash a rapid move higher, a downturn could trigger rapid liquidations given the clustering around pivotal price points like $1,909 and $2,200. The balance of signals — a rising active address base, meaningful staking, and a finite liquidity pool — suggests that further price discovery is likely to be data-driven, with on-chain metrics offering a more durable cross-check for price action than short-term sentiment alone.
This article was originally published as ETH Chart Pattern Signals Rally to $2.5K If Key Conditions Align on Crypto Breaking News – your trusted source for crypto news, Bitcoin news, and blockchain updates.


You May Also Like

What’s Next for BTC After Tanking to $66K?

China solar panel exports to Africa jump by 83% as demand for clean energy surges

Amazon (AMZN) Stock; Rises on $33B Southeast Asia AI and cloud push


